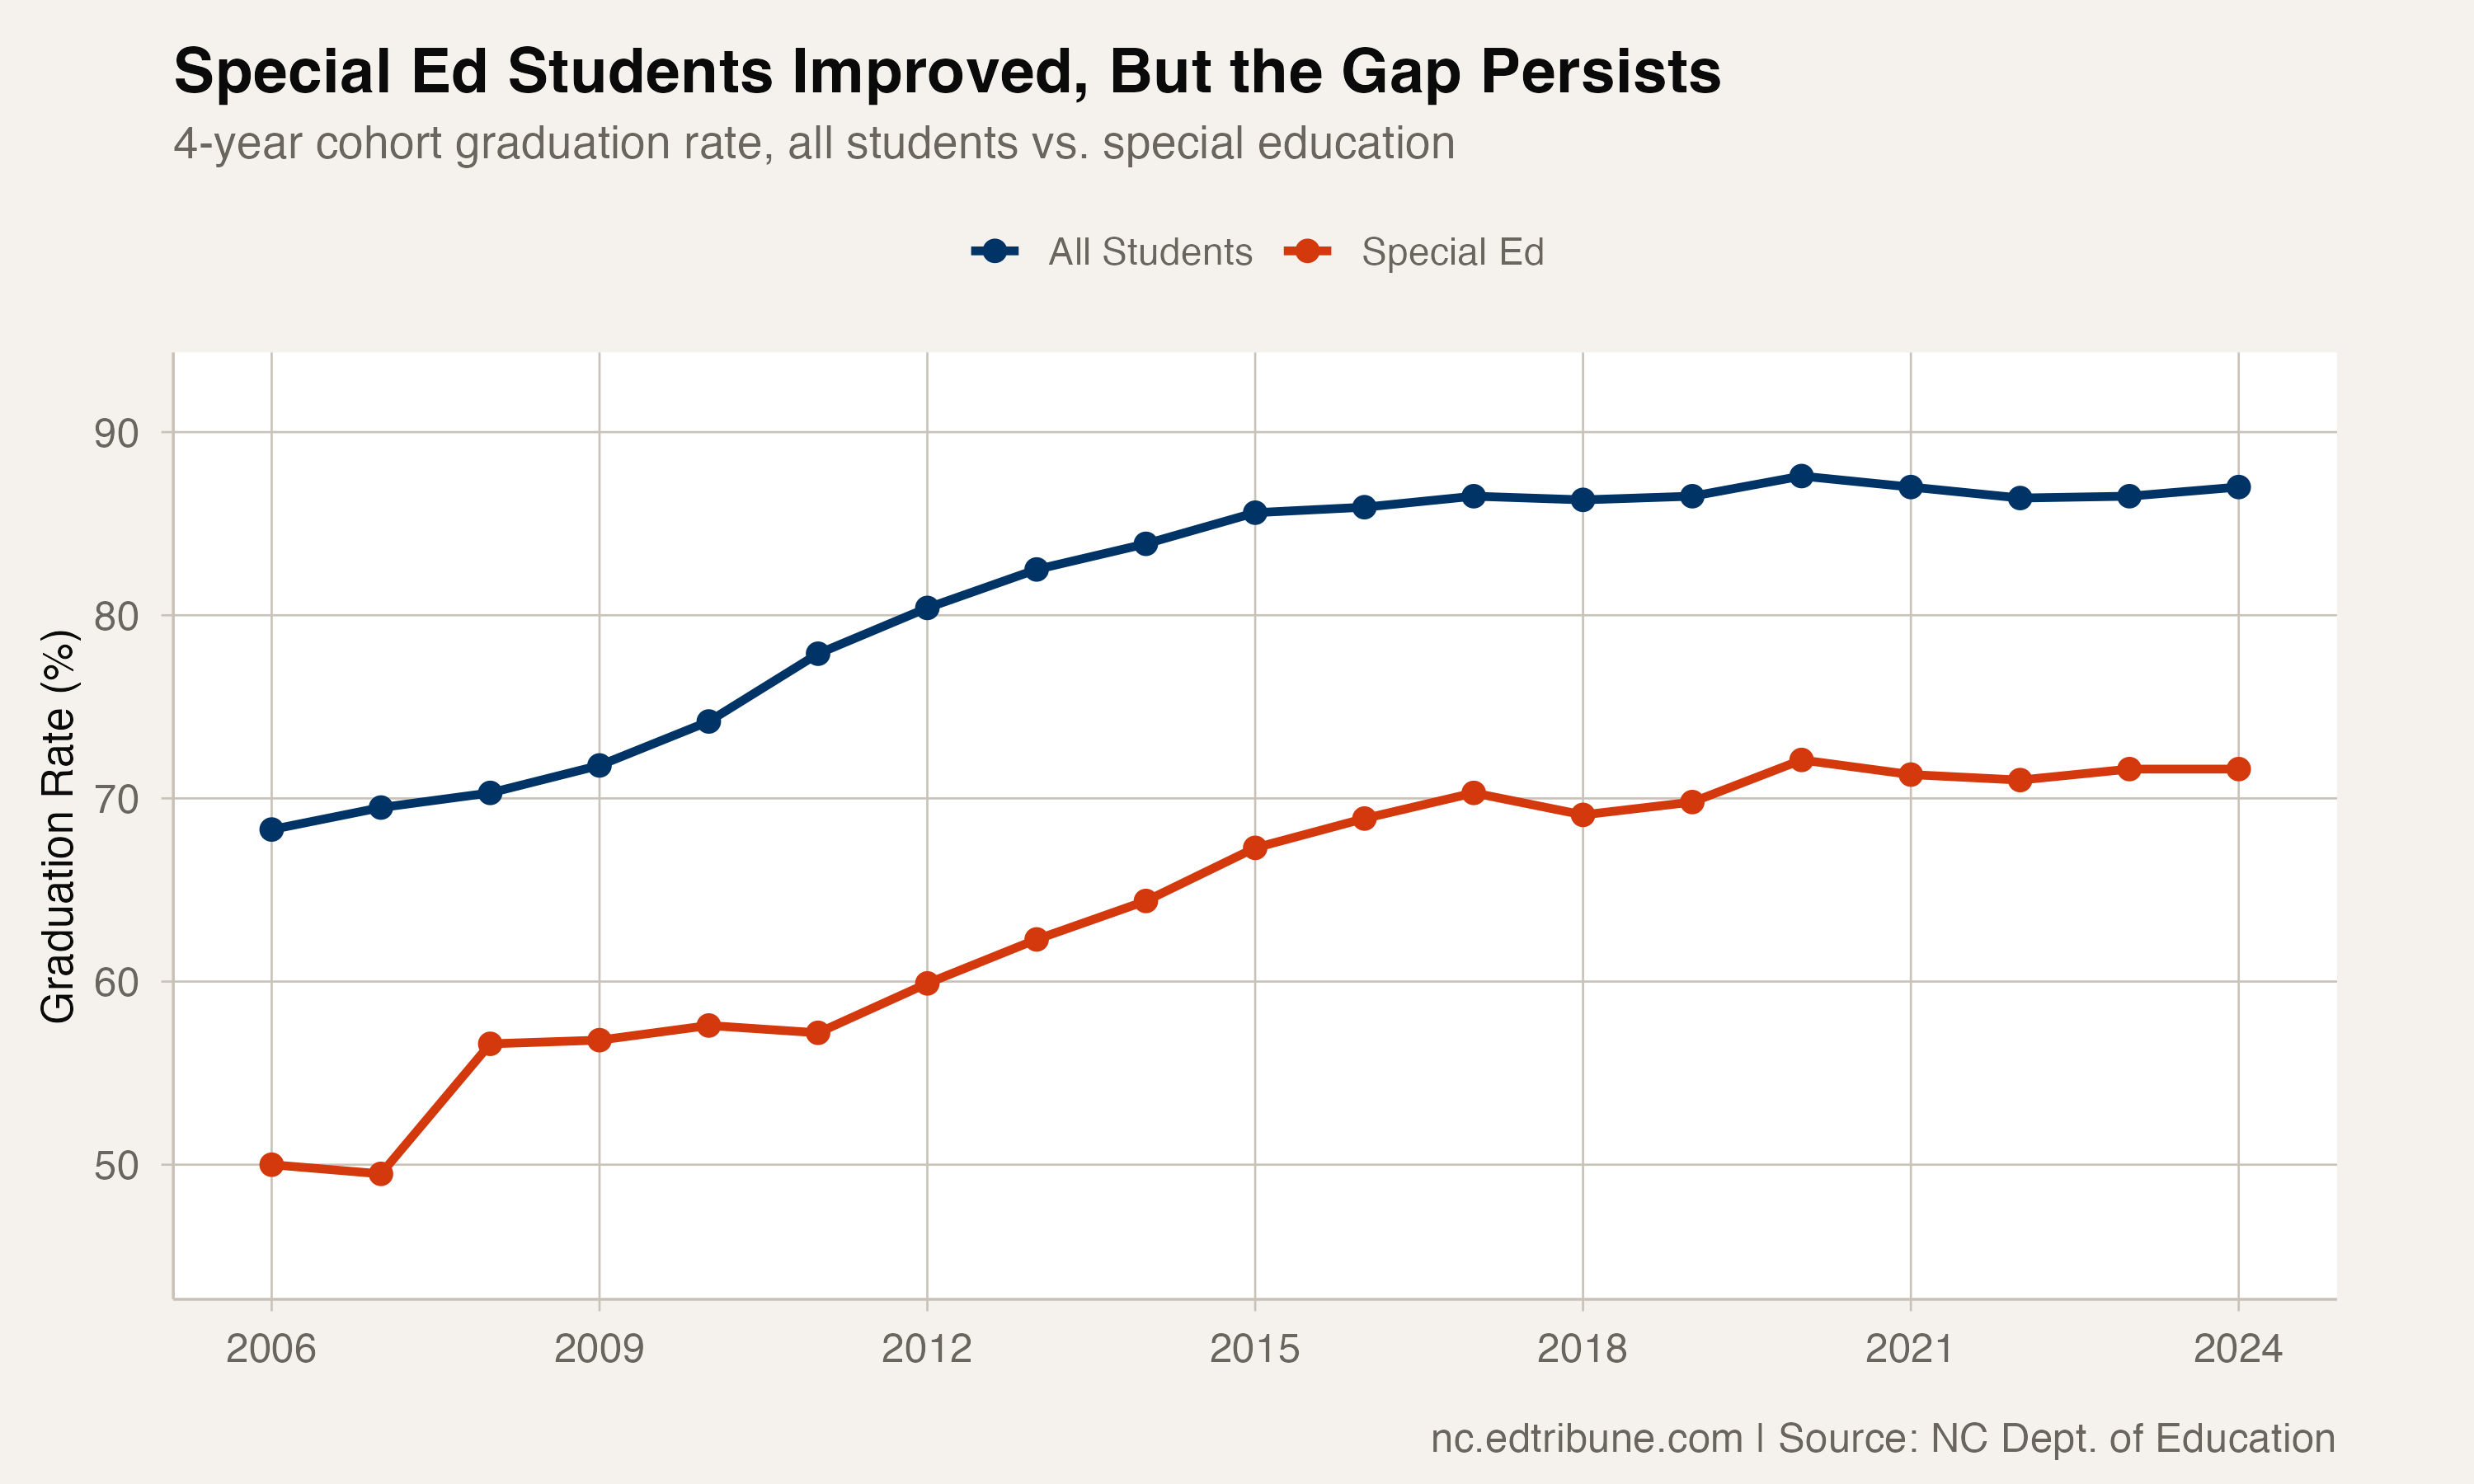
In 2006, half of North Carolina's students who received special education services graduated on time. By 2024, 71.6% did. That is a gain of 21.6 percentage points, one of the largest sustained improvements for any group of students in the state.
The state average climbed too, though, and the two lines moved together. In 2006, the gap between students who received special education services and the state average was 18.3 points. In 2024, it was 15.4 points. Eighteen years of work, and the gap narrowed by less than 3 points.
The parallel track problem
The two graduation rates have moved in near lockstep. When the state climbed from 68% to 87%, the rate for students who received special education services climbed from 50% to 72%. The lines run almost perfectly parallel, as if the same forces lifting graduation overall lifted students with disabilities by roughly the same amount, year after year, never closing the distance between them.
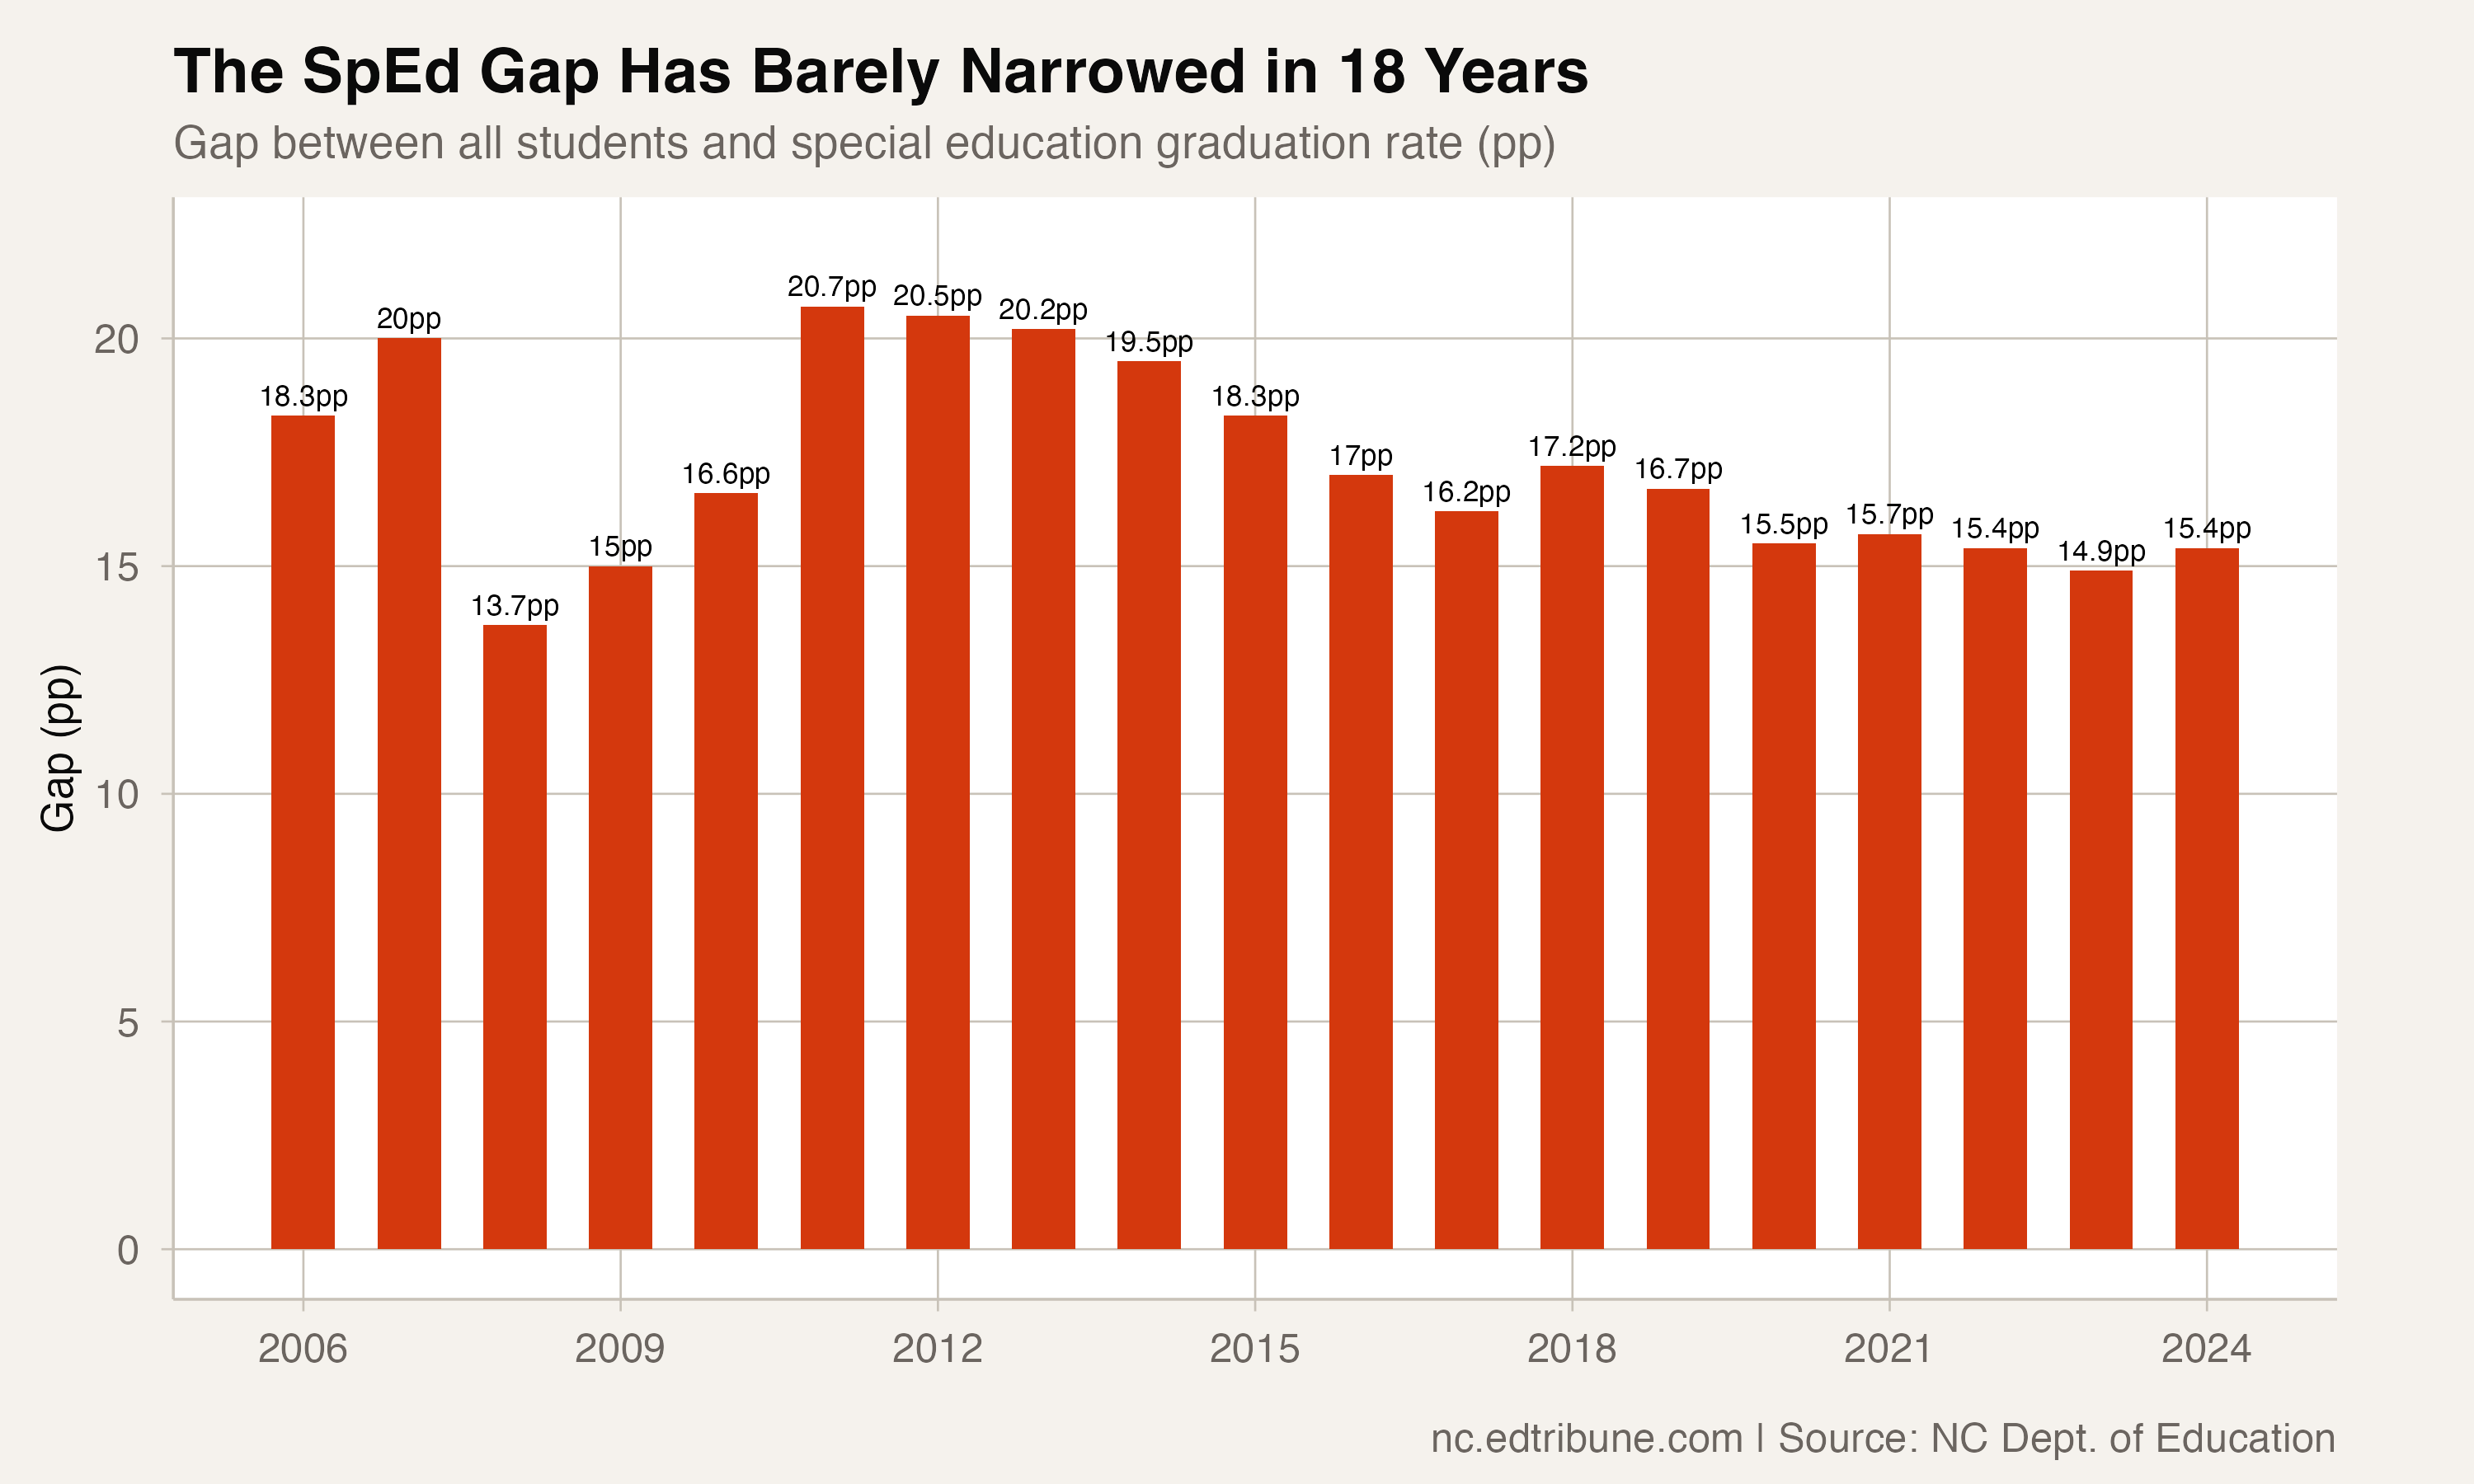
A gap that holds this steady across 18 years of policy change, funding swings, and demographic shifts points to something structural. It suggests a mismatch between what the standard graduation pathway demands and what many students with disabilities can reach within four years.
Where it fits among equity gaps
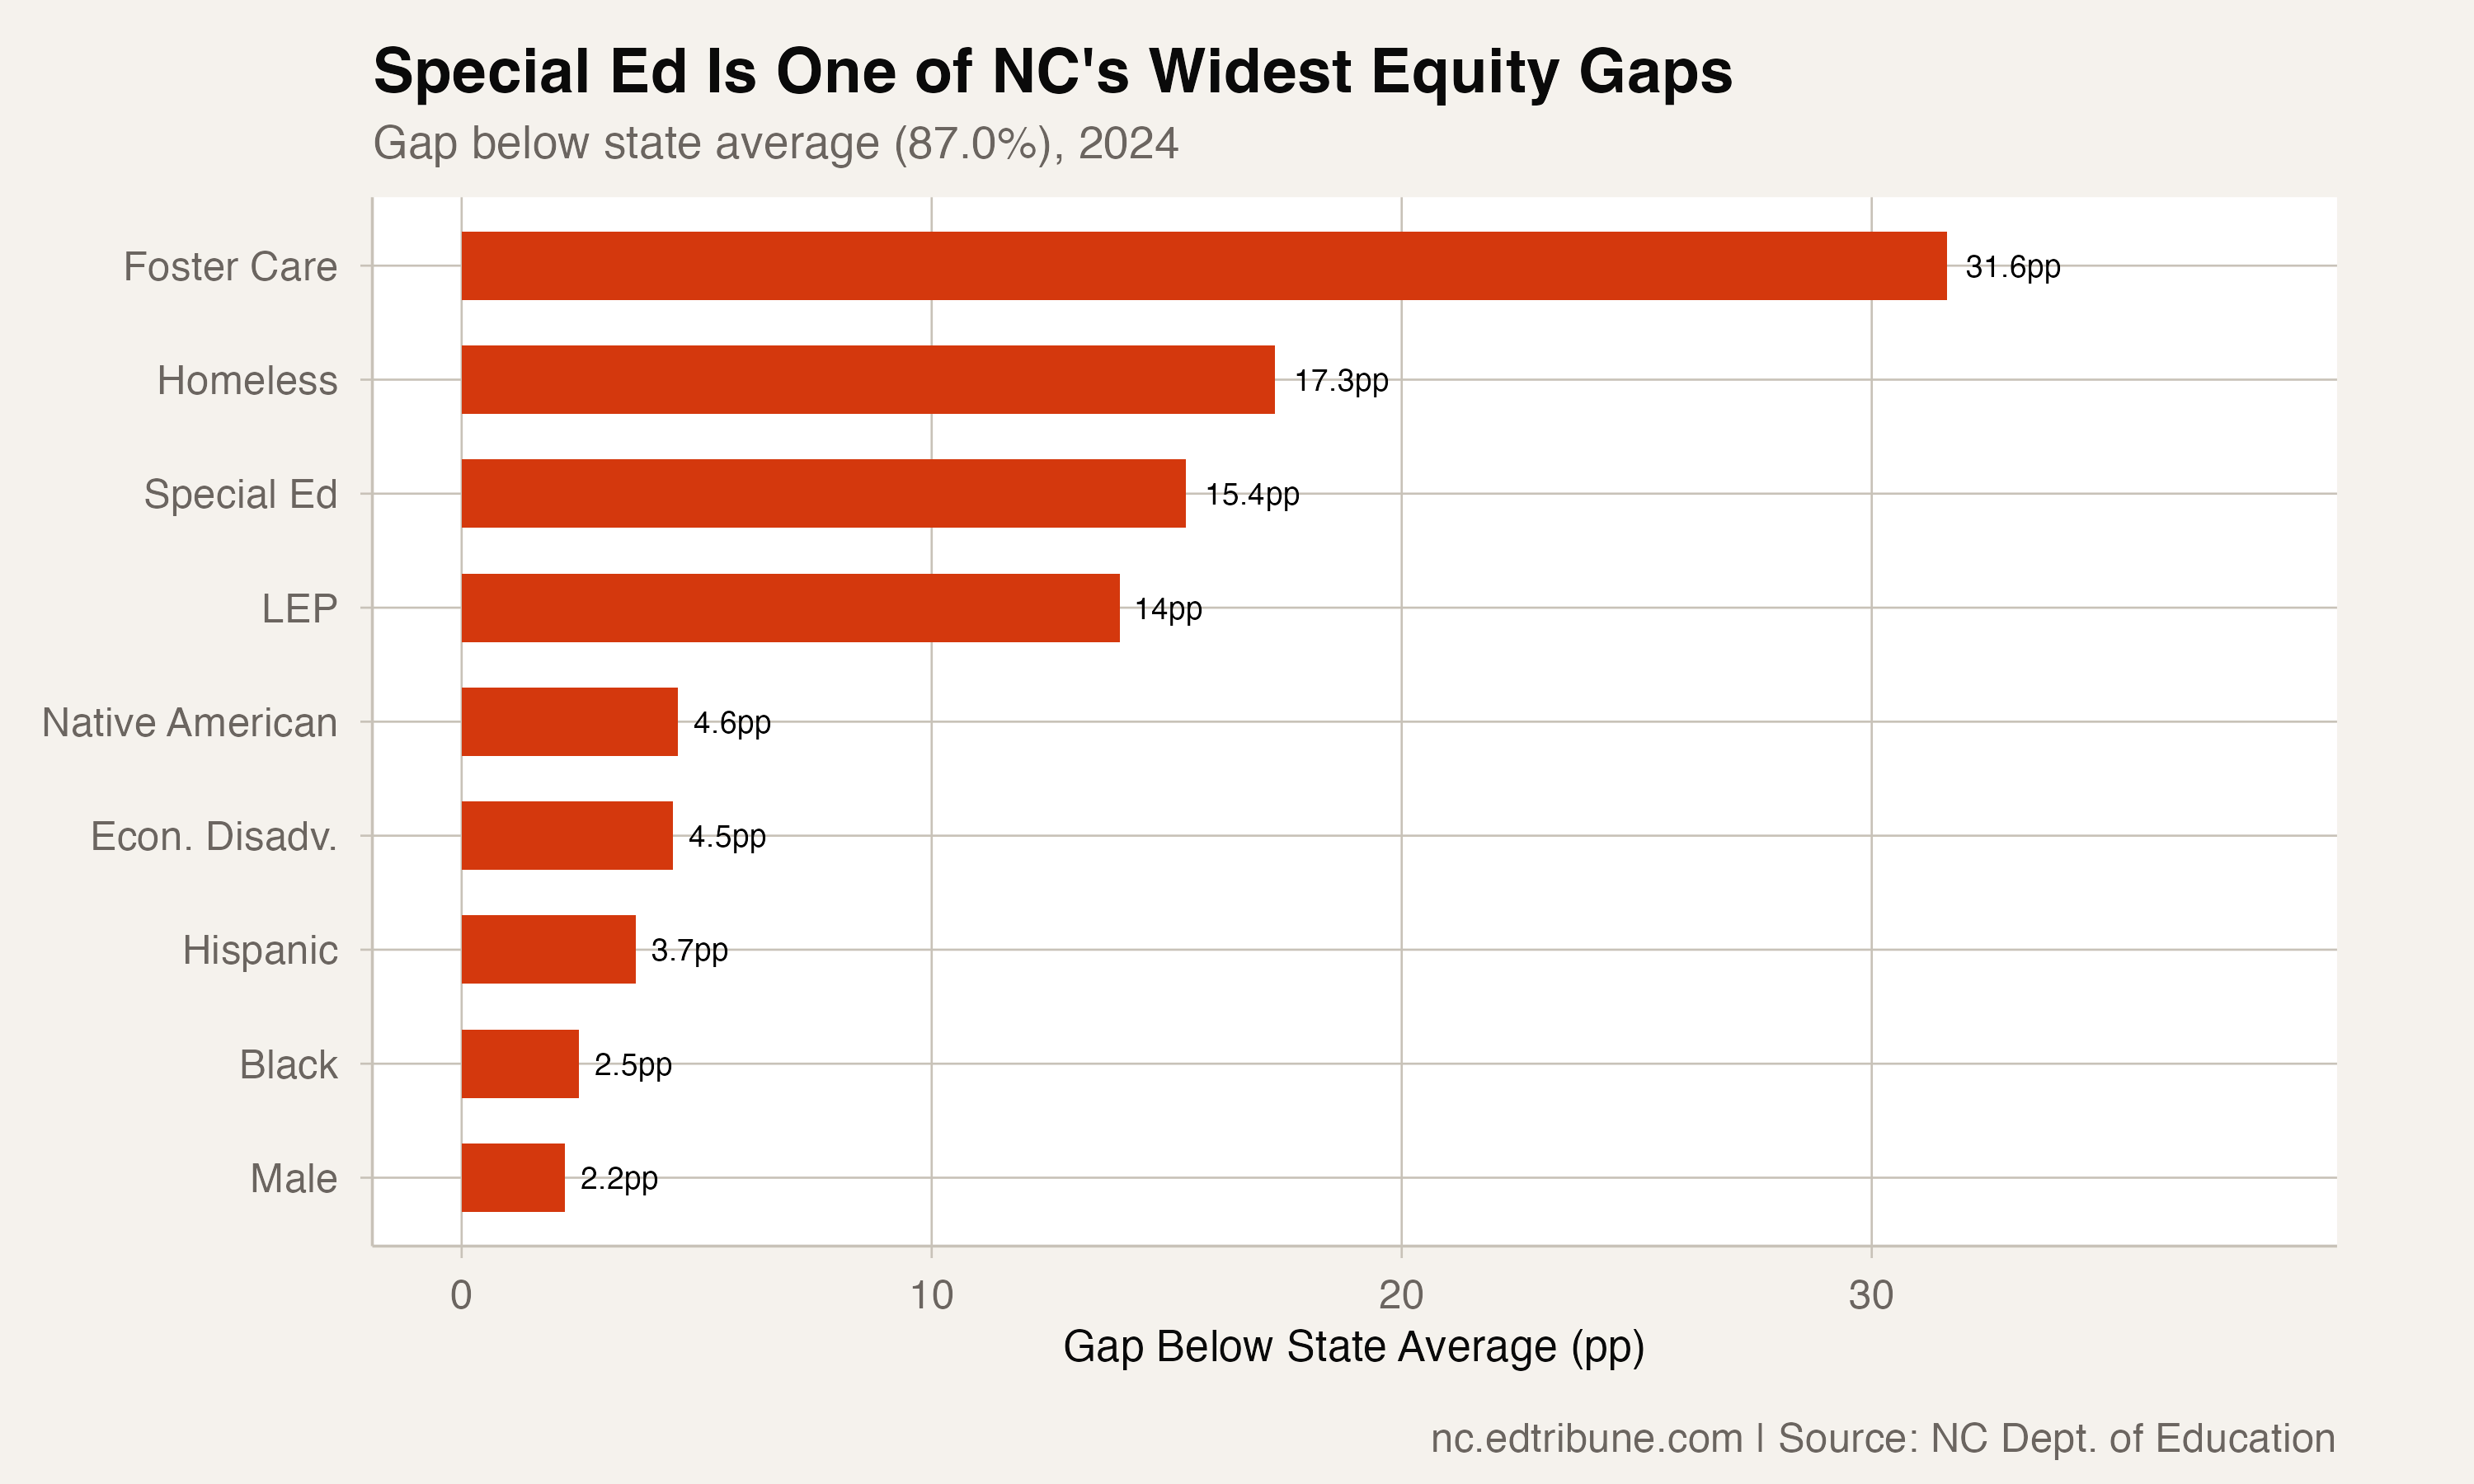
In 2024, the 15.4-point gap for students with disabilities was the third widest the state tracks, behind students in foster care (31.6 points) and students who are currently homeless (17.3 points). It runs wider than the gap for students learning English (14.0 points), the gap between Black and white students (5.3 points), or the gap between boys and girls (4.4 points).
About 15,233 students who received special education services were in the 2024 graduation cohort. At the state average rate, roughly 2,340 more of them would have walked across a stage on time. That is one of the largest single-group contributions to the distance between North Carolina's current 87% rate and its 92% goal.
Where the other 28% go
The 28.4% of students with disabilities who do not graduate on time do not all follow the same path. Some stay enrolled past four years and earn a diploma later. Others leave.
About 19% of students with Individualized Education Programs exit special education by dropping out, which makes dropping out the most common exit other than graduation for this group. That points back at the diploma itself: 22 credits across the Future-Ready Course of Study, a sequence that some students whose IEPs call for a different pace or set of supports cannot complete inside the four-year window.
North Carolina offers diploma endorsements and modified course sequences, but the four-year cohort rate measures on-time completion of the standard diploma. Students who take an alternative timeline or earn a certificate count as non-graduates in this number, even when they finish later.
What narrowing would require
The broad measures that lifted the overall rate have not closed this gap. The approaches that do show promise are narrower and more expensive: transition planning that starts earlier, work-based learning, co-teaching models that keep students with disabilities in general education classrooms. Each requires real per-pupil investment.
North Carolina's Exceptional Children division sets special education policy statewide, but what happens in a classroom depends on the district. Places with dedicated graduation coaches for students with disabilities tend to post narrower gaps. Spreading that model across 115 districts is the harder part.
Detailed code that reproduces the analysis and figures in this article is available exclusively to EdTribune subscribers.
Discussion
Sign in to join the discussion.
Loading comments...