In 2006, North Carolina's charter high schools graduated students at a mean rate of 55.4% — 13.6 percentage points behind traditional schools at 69.0%. The deficit was large enough to fuel skepticism about whether charter schools were serving their students well.
Eighteen years later, the gap has effectively vanished.
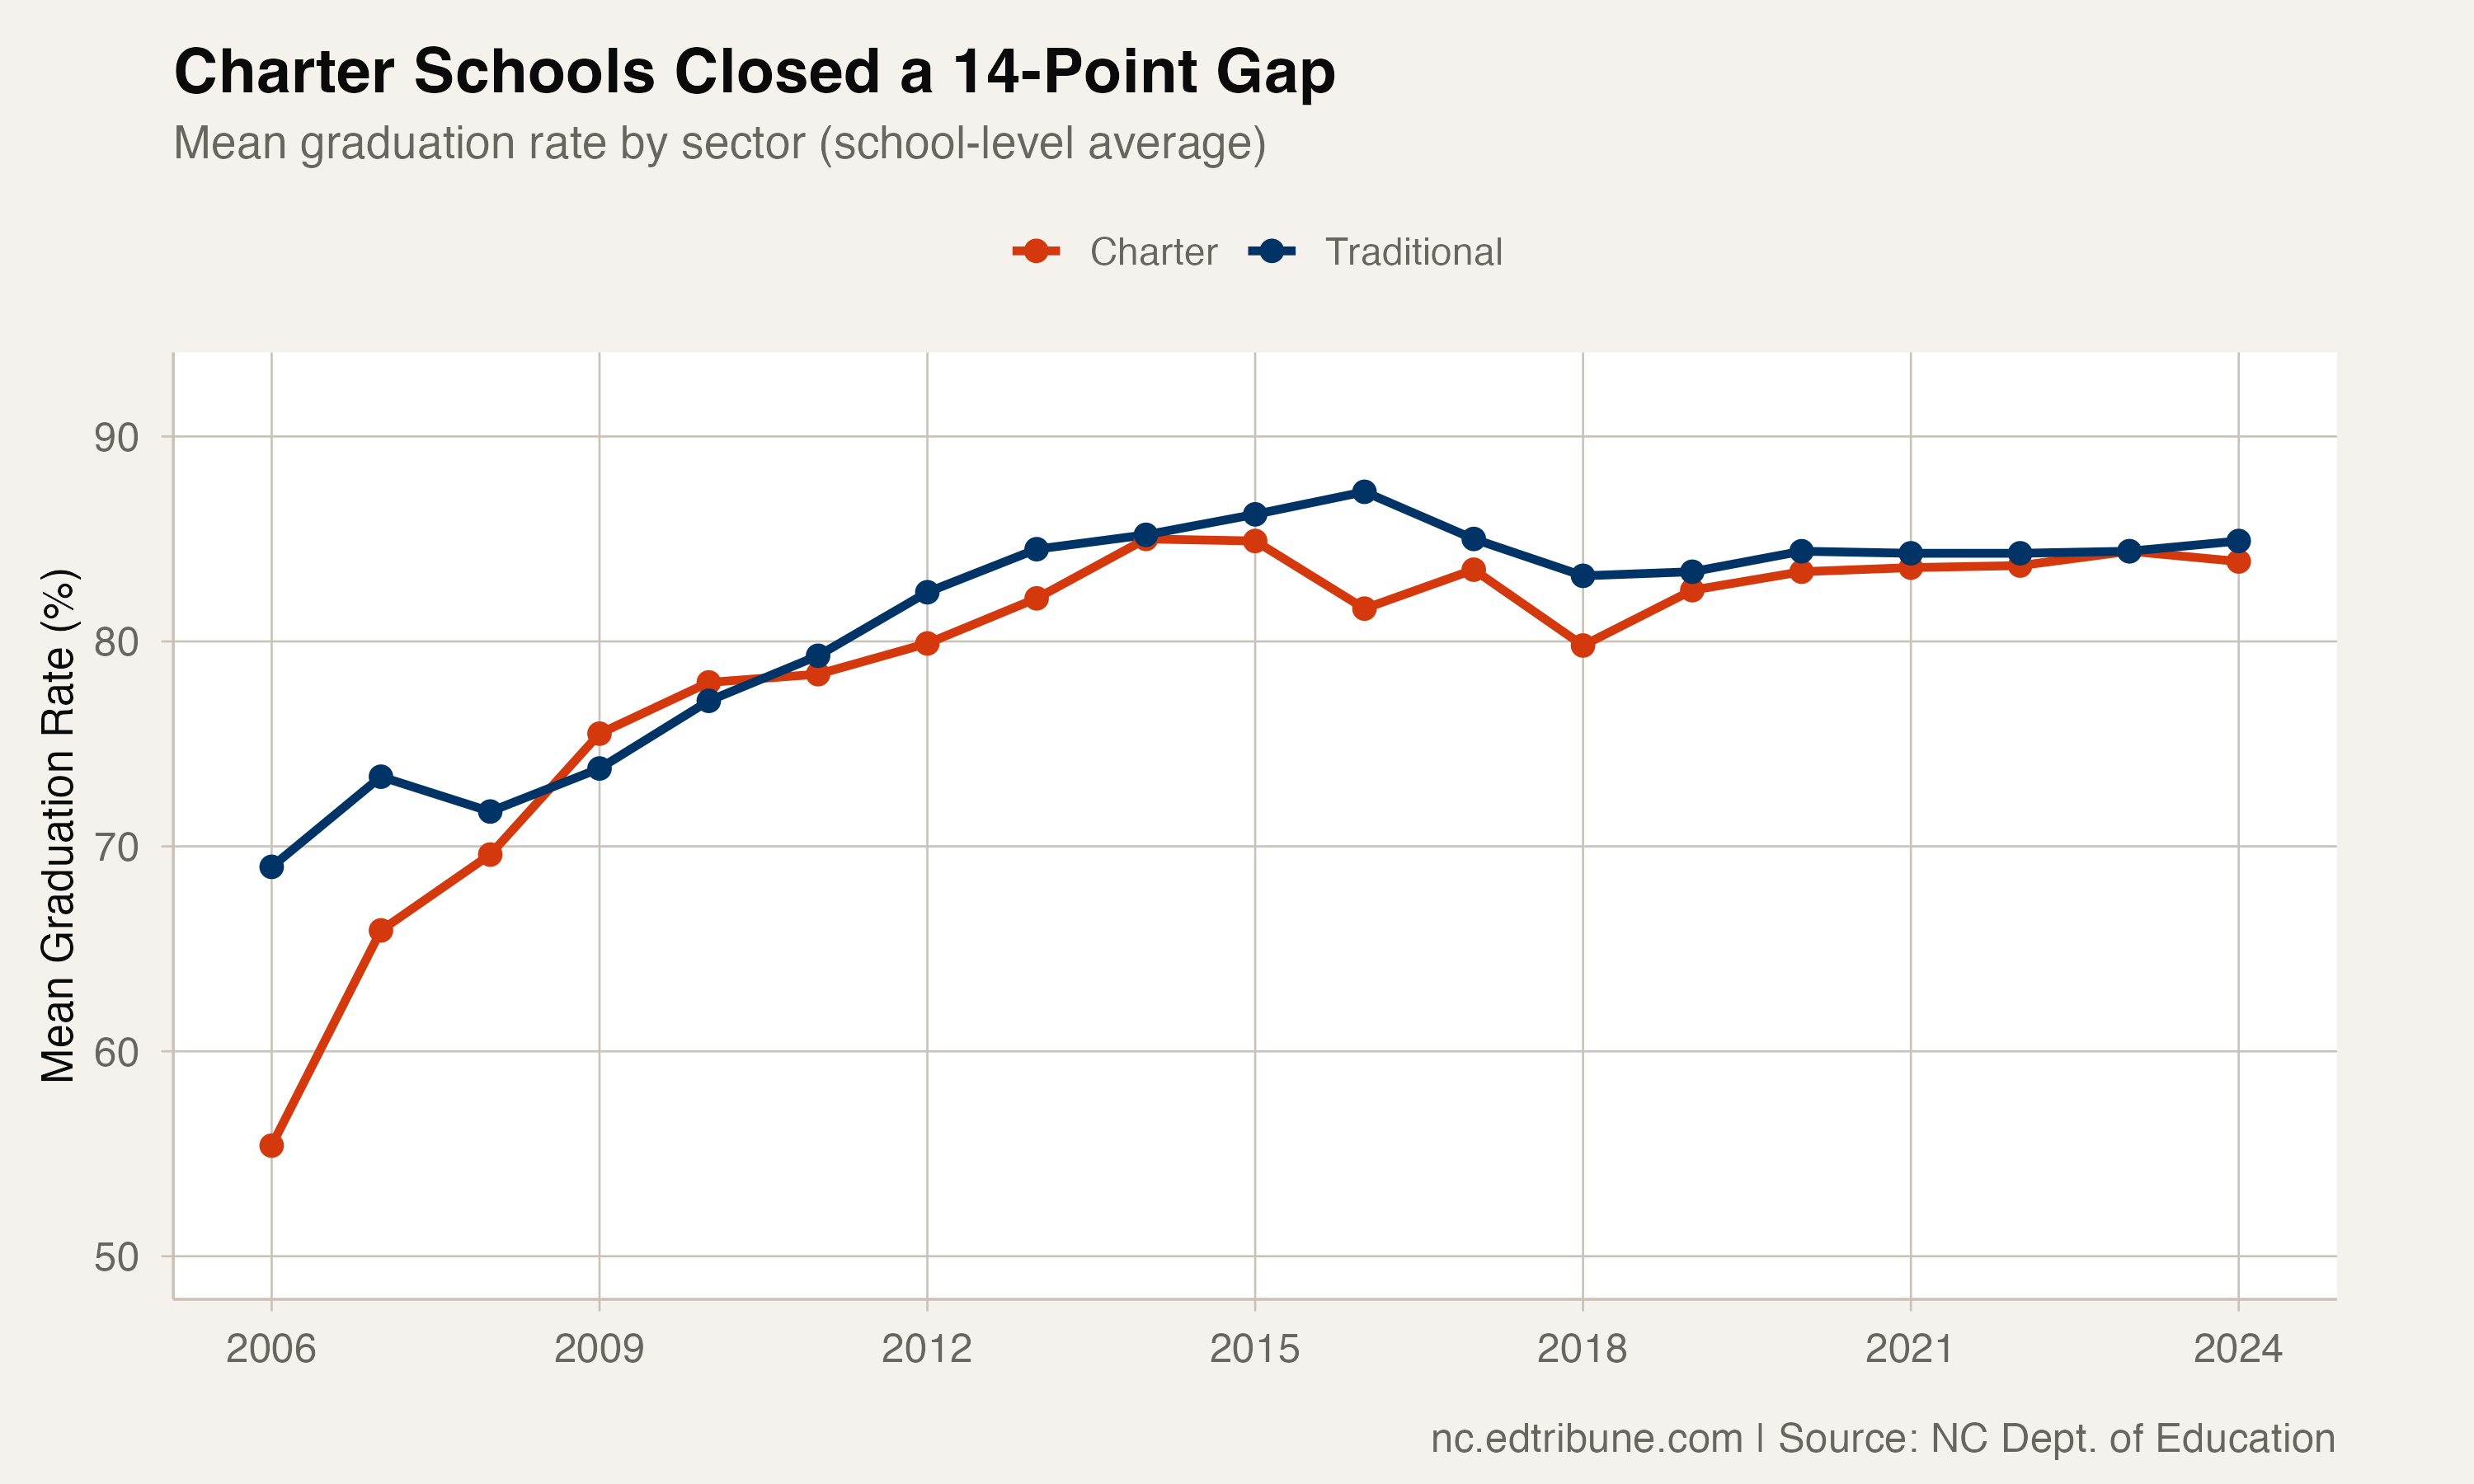
By 2024, charter schools post a mean graduation rate of 83.9%, just 1.0 point behind traditional schools at 84.9%. The convergence happened gradually but persistently, narrowing in nearly every year of the data series.
Growth alongside improvement
The convergence is more notable because it happened while the charter sector was expanding dramatically. North Carolina had about 20 charter high schools reporting graduation rates in 2006. By 2024, that number has grown to 85.
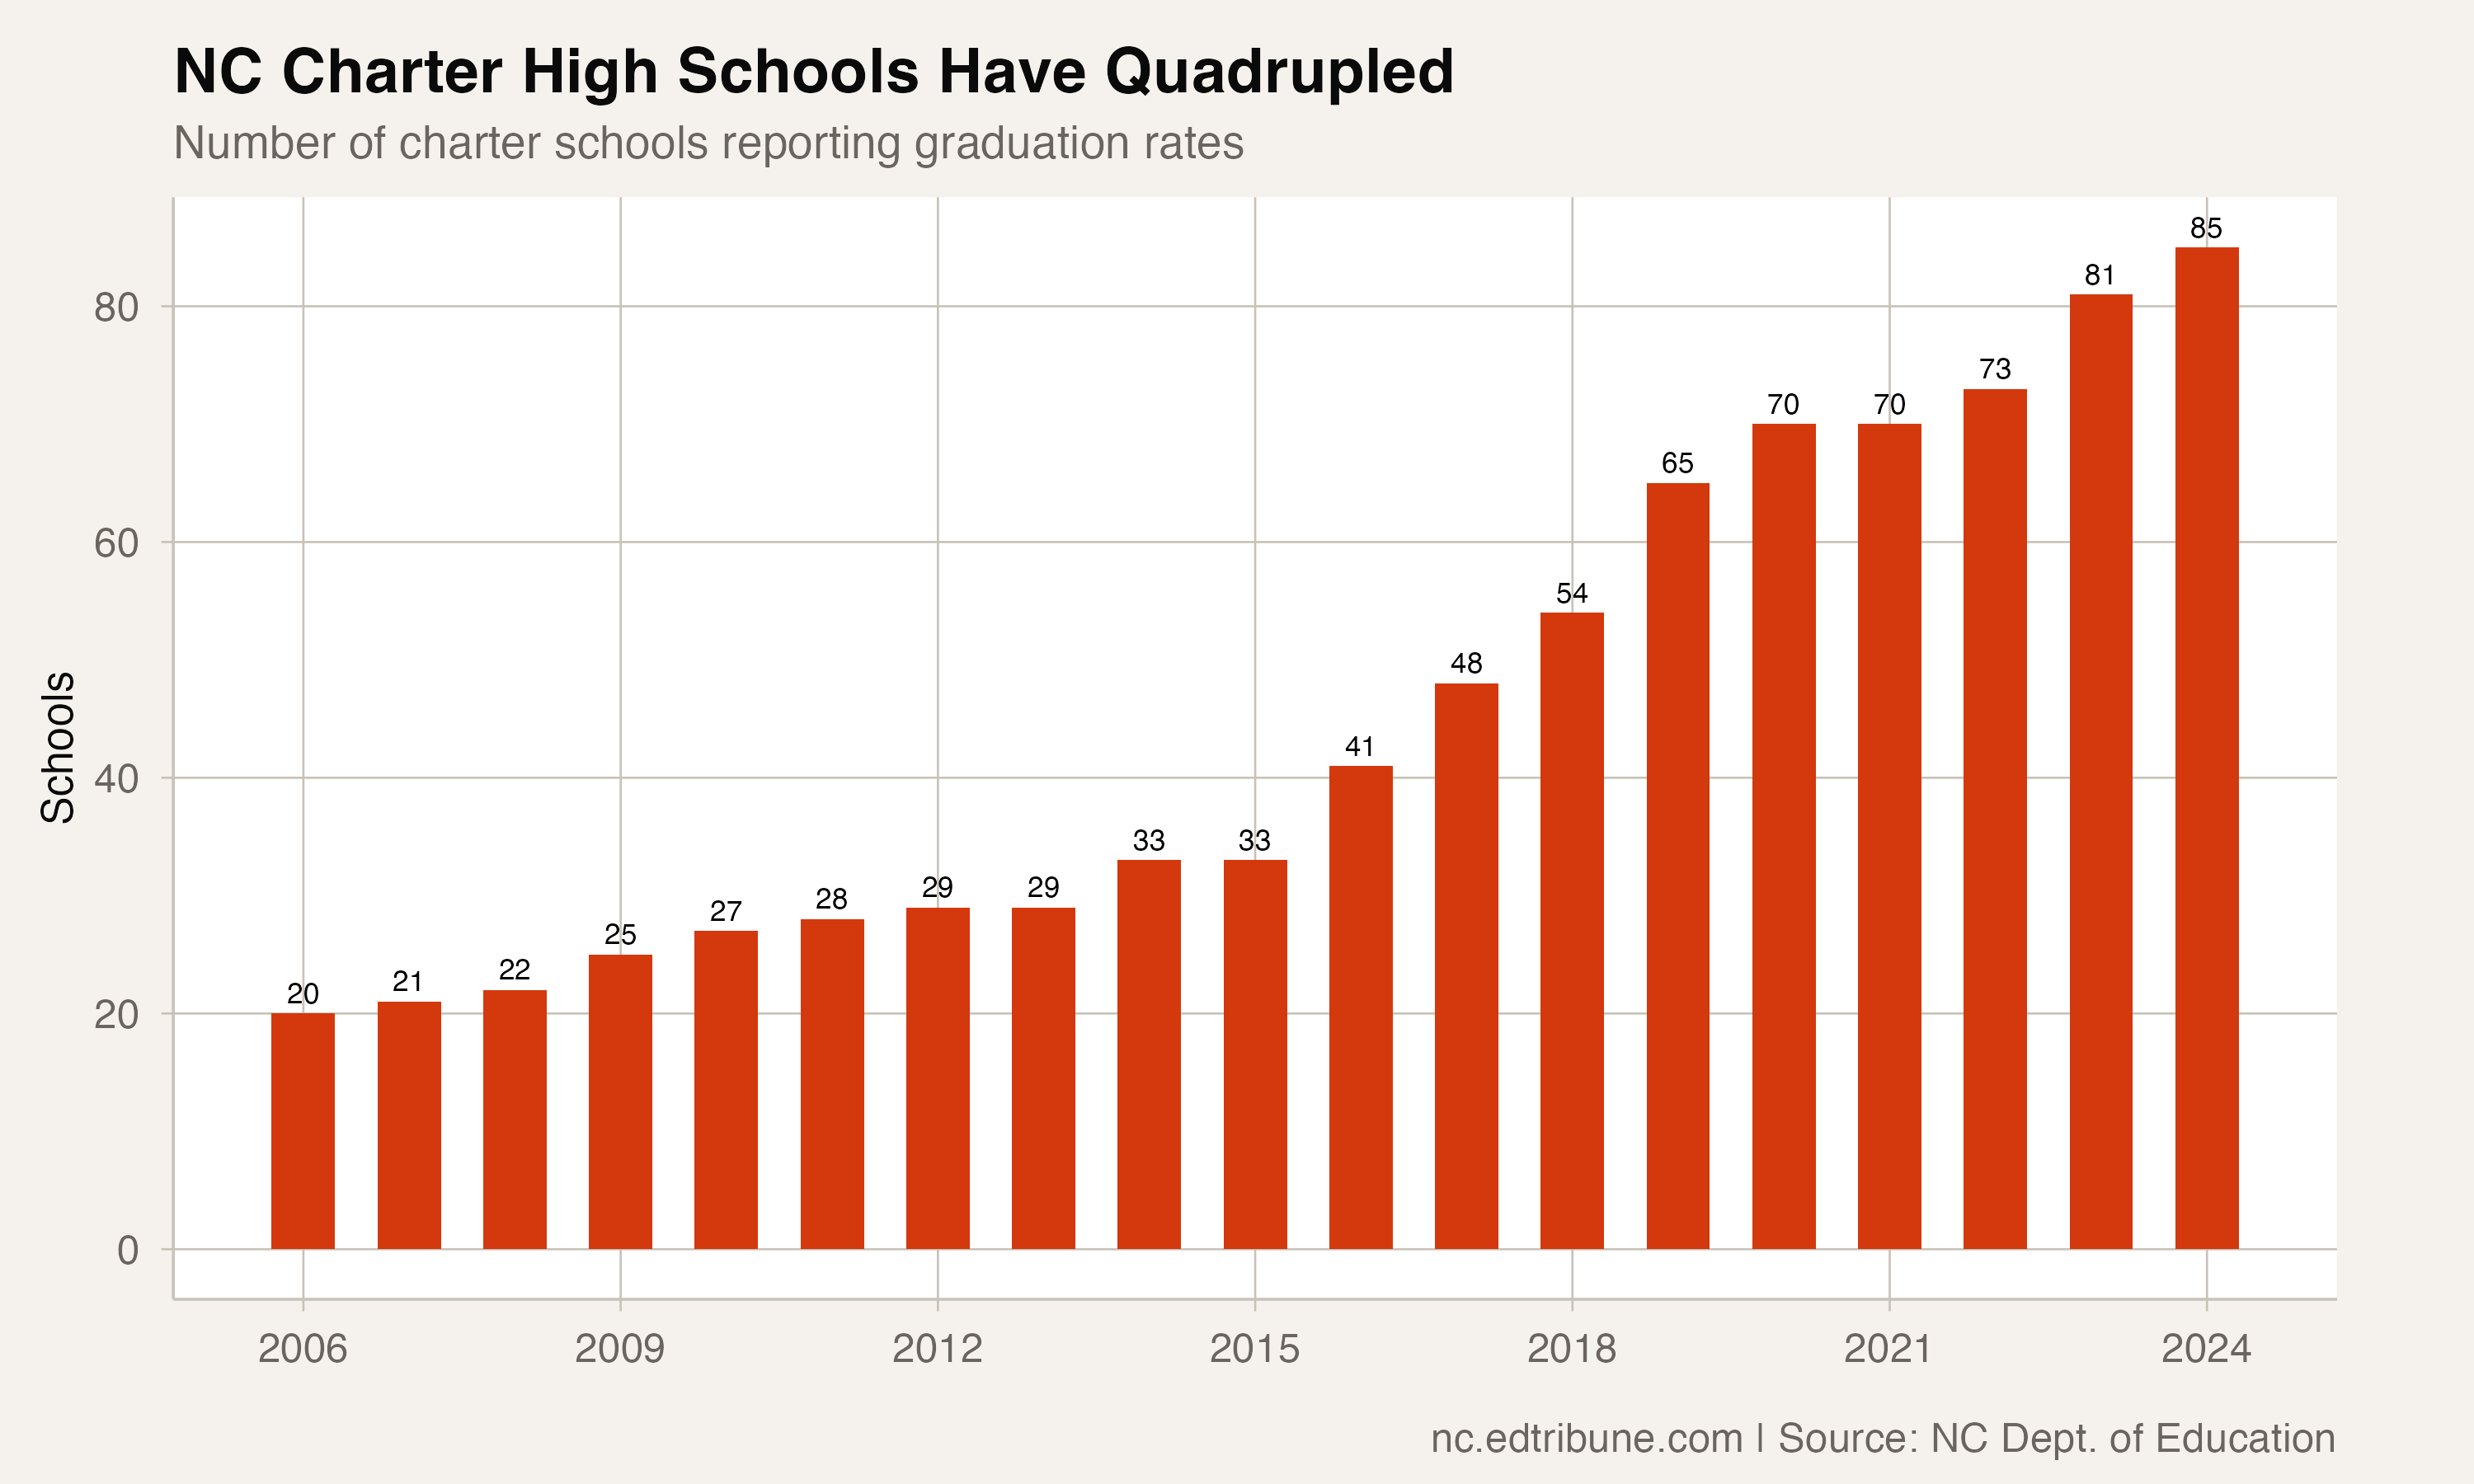
Rapid sector expansion typically depresses average quality — new entrants tend to underperform established schools in the short term. That the charter average rose from 55% to 84% while the sector grew fourfold suggests that the newer charter schools are performing at or above the rates of the pioneers.
The variance underneath
Convergence in mean rates masks a critical difference between the sectors: charter school graduation rates vary far more than traditional school rates.
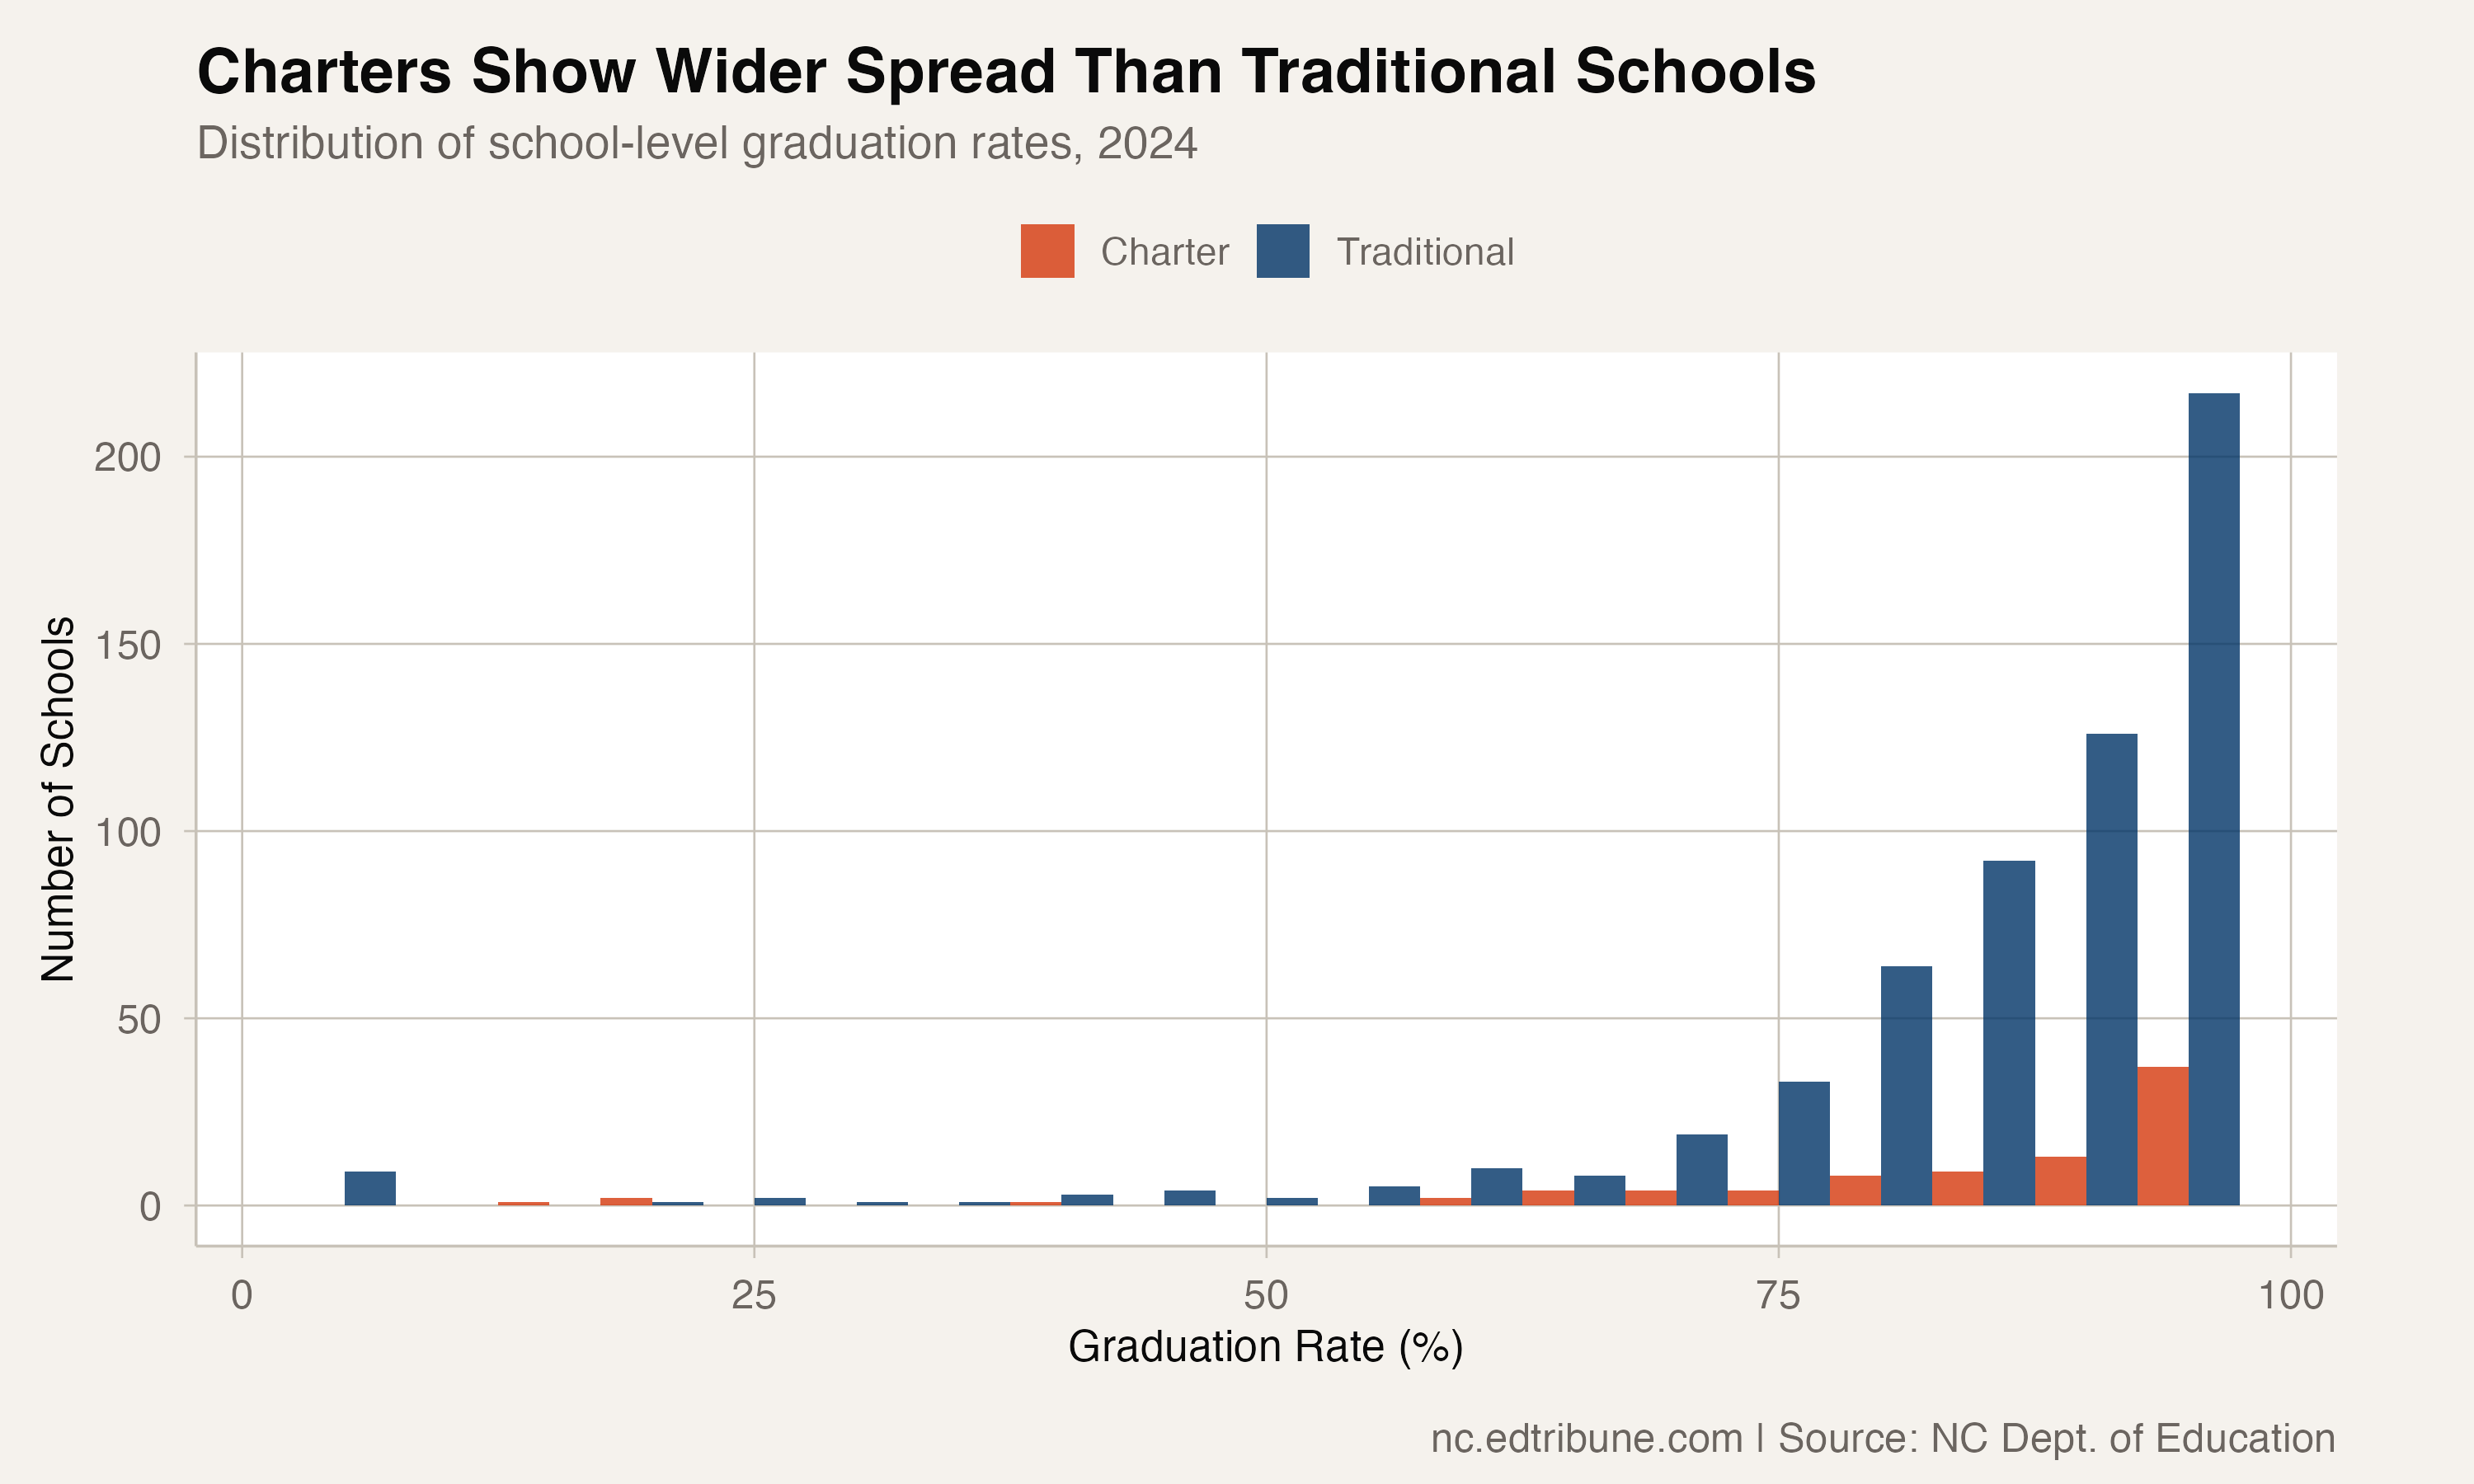
In 2024, charter school graduation rates range from some of the lowest in the state to some of the highest. The standard deviation of charter rates is wider than for traditional schools. Some charter schools graduate nearly every student; others lose a third or more.
This variance is the real story. The mean charter rate at 84% is not the experience of a typical charter student — it is the arithmetic blend of high-performing and low-performing schools with little in between. A parent choosing a charter school in North Carolina might land at a school that outperforms every traditional option in the area, or one that significantly underperforms.
What the data can and cannot say
The comparison requires caveats. Charter school graduation rates are calculated at the school level and averaged, while traditional school rates are calculated at both school and district levels. The mean of school-level rates is not the same as a student-weighted rate, and the charter average gives equal weight to a school with 30 graduates and one with 300.
North Carolina's charter schools also serve a different demographic mix than traditional schools in many communities, making direct comparison complex. Self-selection effects — the families who choose charter schools may differ systematically from those who do not — further complicate causal interpretation.
What the data shows without ambiguity is that the sector-level gap has closed. Whether that reflects genuine improvement in charter school quality, compositional changes as the sector grew, or changes in which students attend charter schools is a question the graduation rate data alone cannot answer.
Detailed code that reproduces the analysis and figures in this article is available exclusively to EdTribune subscribers.
Discussion
Sign in to join the discussion.
Loading comments...