No subgroup in North Carolina's graduation data tells a stranger story than limited English proficient students. The LEP graduation rate has jumped, dropped, spiked, and surged with a volatility that makes trend analysis treacherous and simple narratives impossible.
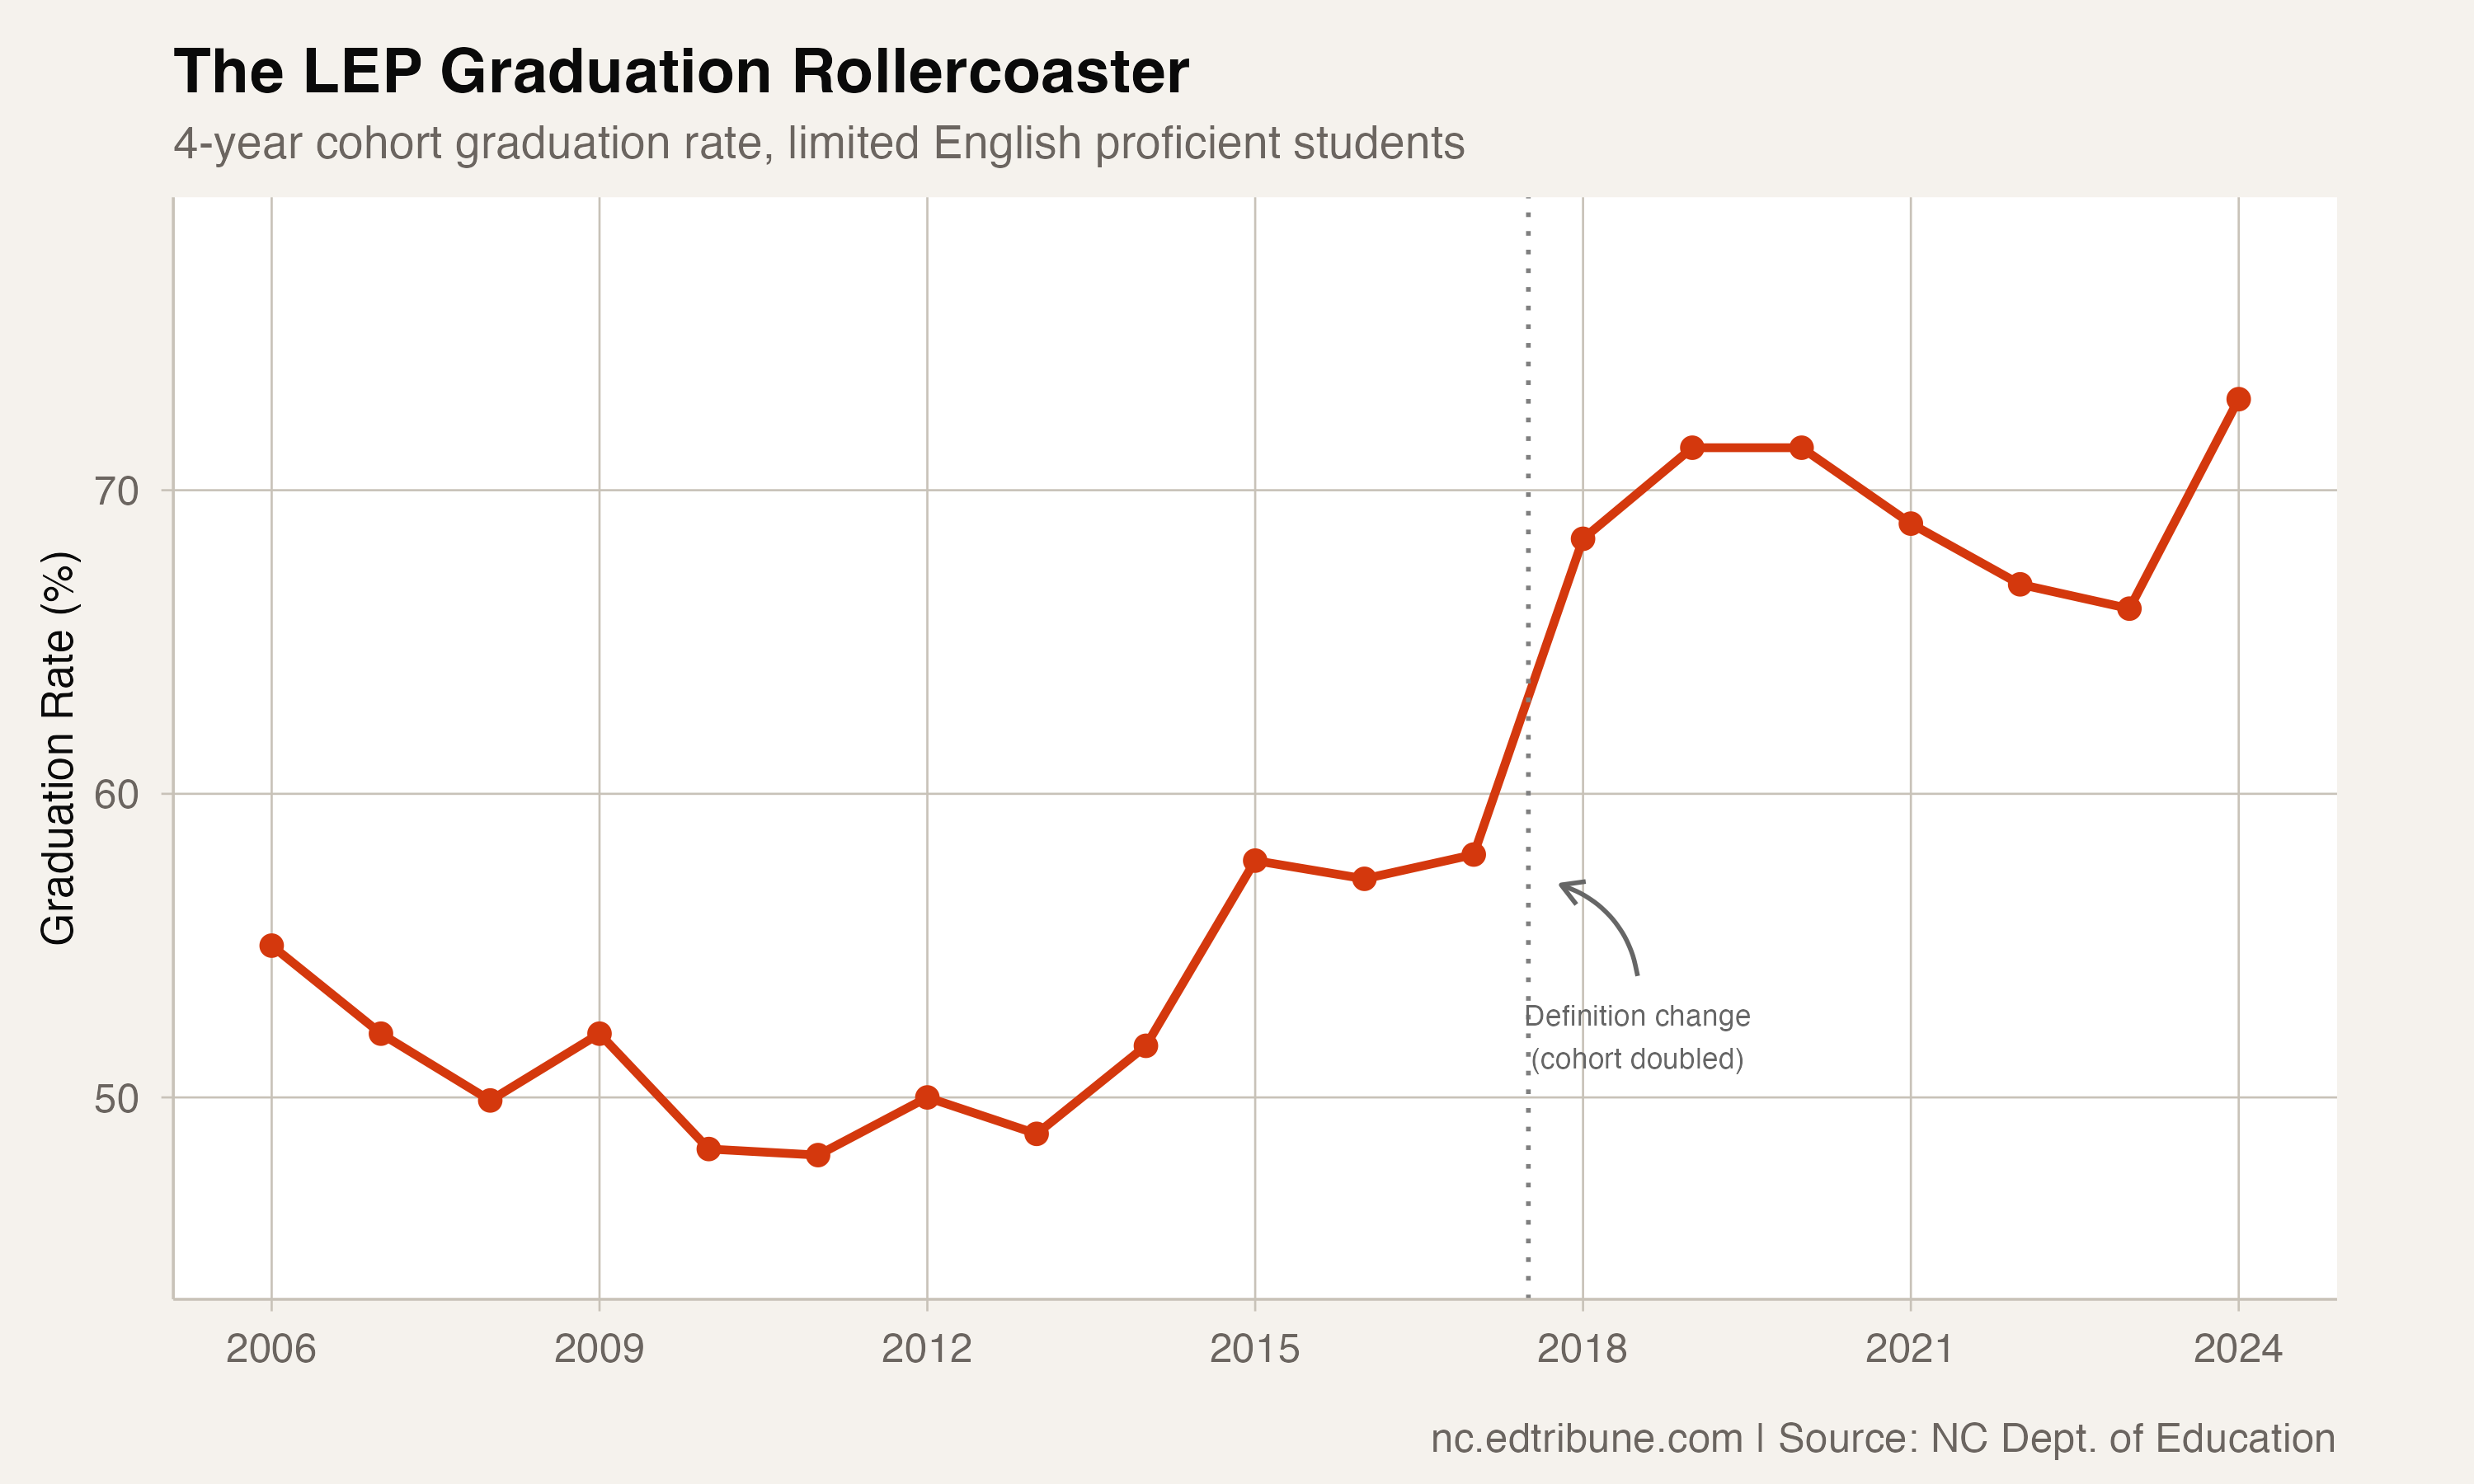
In 2024, the rate stands at 73.0% — up 18 points from 55.0% in 2006, and representing the highest rate on record. But the path from there to here involves a definition change that doubled the cohort overnight, a decade of stagnation, and a single-year surge in 2024 that added 6.9 percentage points.
Two eras, one break
The LEP graduation story has a structural break in 2018 that makes before-and-after comparisons problematic. In 2017, the LEP cohort was 2,884 students and the rate was 58.0%. In 2018, the cohort jumped to 6,835 students — more than doubling — and the rate spiked 10.4 percentage points to 68.4%.
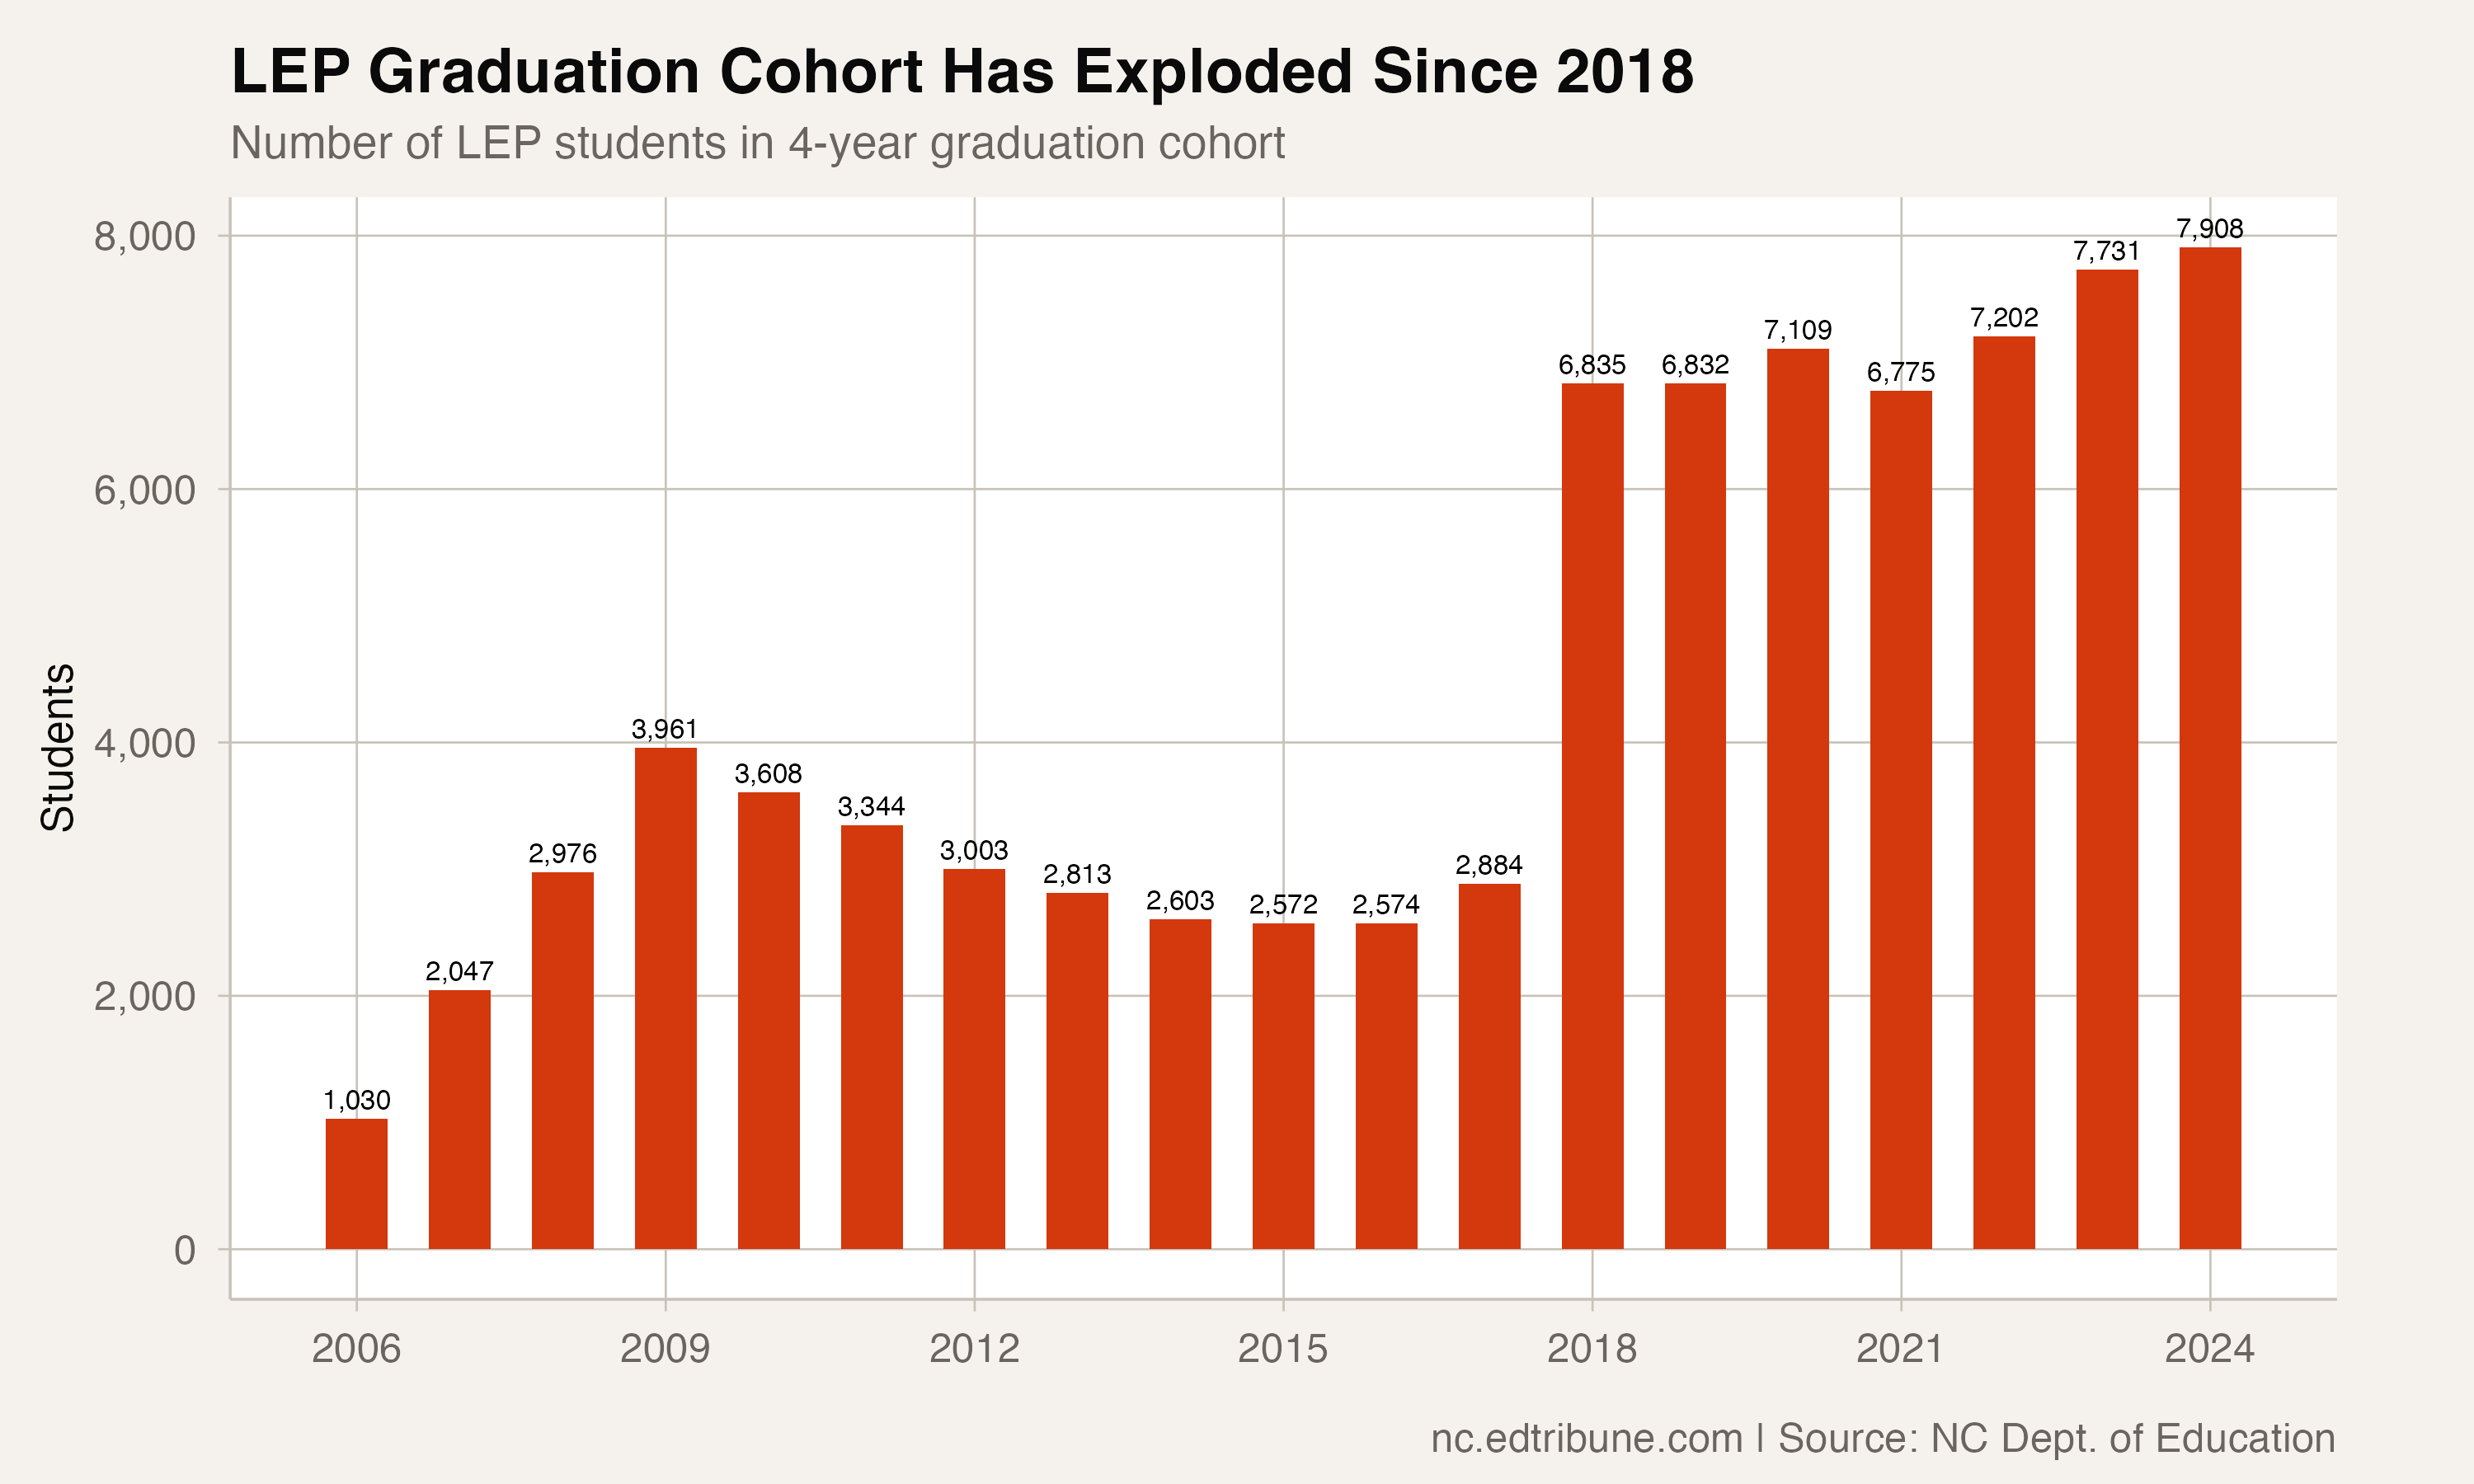
This almost certainly reflects a change in how North Carolina classified LEP students for graduation cohort purposes — likely expanding the definition to include students who had exited English learner services but were still being monitored. The rate increase and cohort expansion happening simultaneously is the signature of a reporting change, not a genuine improvement of 10 points in a single year.
The 2018 break means the pre-2018 and post-2018 data are measuring different populations. The 55-58% rates before 2018 applied to a narrower, likely more linguistically challenged group. The 66-73% rates after 2018 include a broader population that was always graduating at higher rates.
The post-2018 trajectory
Even within the post-2018 era, the LEP rate has been volatile. It peaked at 71.4% in 2019-2020, dropped back to 66.1% by 2023, then surged to 73.0% in 2024 — a 6.9 percentage point jump that was the largest single-year gain of any subgroup.
The 2024 surge is notable because it happened with a cohort of nearly 8,000 students, large enough to resist random fluctuation. Whether it marks a genuine trend break or a one-year anomaly will only be clear with future data.
The gap that remains
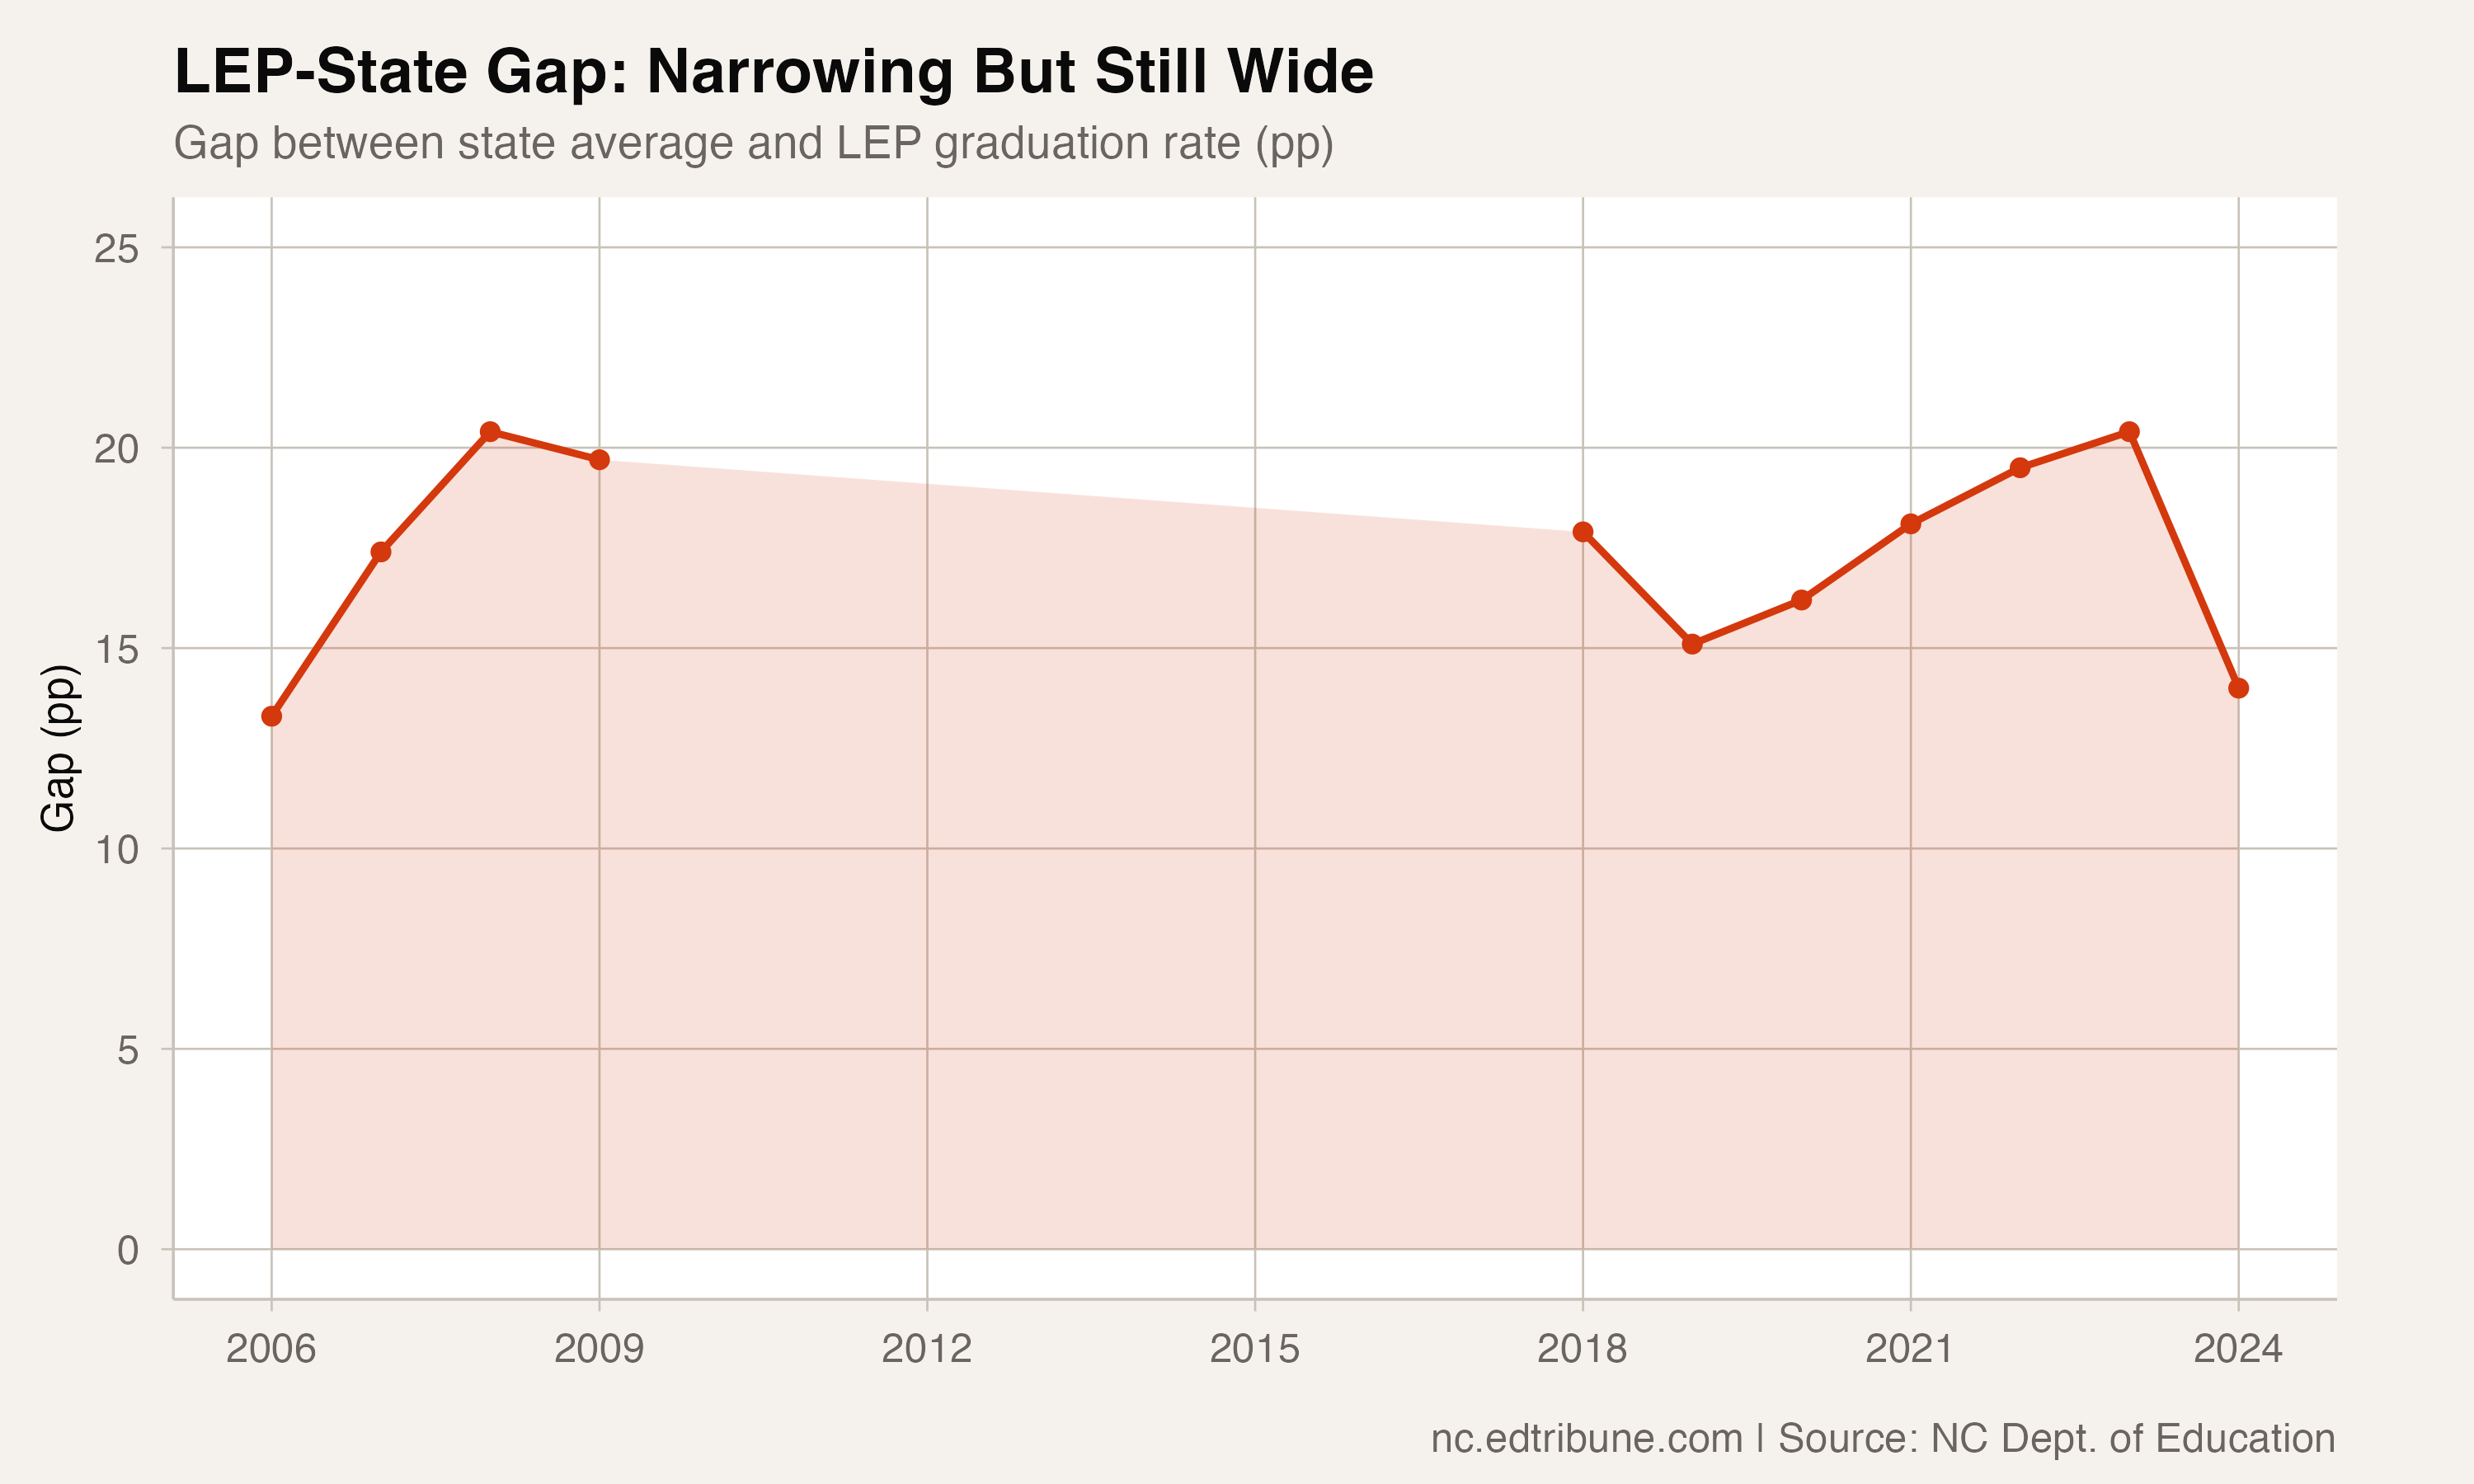
At 73.0%, LEP students trail the state average of 87.0% by 14.0 percentage points — the fourth-widest equity gap after foster care, students who are currently homeless, and special education. More than one in four English learners in North Carolina does not graduate on time.
The gap is partly structural. Students who arrive in the United States during high school face the impossible task of simultaneously learning English and completing a 22-credit course of study in four years. For a student who enrolls in a North Carolina high school at age 16 speaking limited English, the four-year clock starts immediately.
But the gap also reflects systemic factors. North Carolina's English learner population has grown rapidly, particularly in rural areas where ESL infrastructure was built from scratch in the past two decades. The quality and availability of English learner support varies widely by district.
Reading the data carefully
The LEP graduation story demands caution. The 2018 definition change makes 19-year trendlines misleading. The year-to-year volatility makes single-year gains unreliable predictors. And the growth of the cohort from about 3,000 to 8,000 students means the LEP population's composition has changed substantially.
What the data does show clearly is that English learners remain one of the most underserved populations in North Carolina's graduation pipeline, and that the post-COVID recovery for this group has been uneven and uncertain.
Detailed code that reproduces the analysis and figures in this article is available exclusively to EdTribune subscribers.
Discussion
Sign in to join the discussion.
Loading comments...