Correction (April 22, 2026): District-level enrollment and chronic absence counts in this article were corrected after a data processing error was identified. Chronic absence rates were not affected.
The chronic absenteeism gap between Black and White students in North Carolina was 6.7 percentage points before the pandemic. It is now 11.7. Nearly one in three Black students, 31.5%, missed at least 18 days of school in 2023-24 compared to one in five White students at 19.9%.
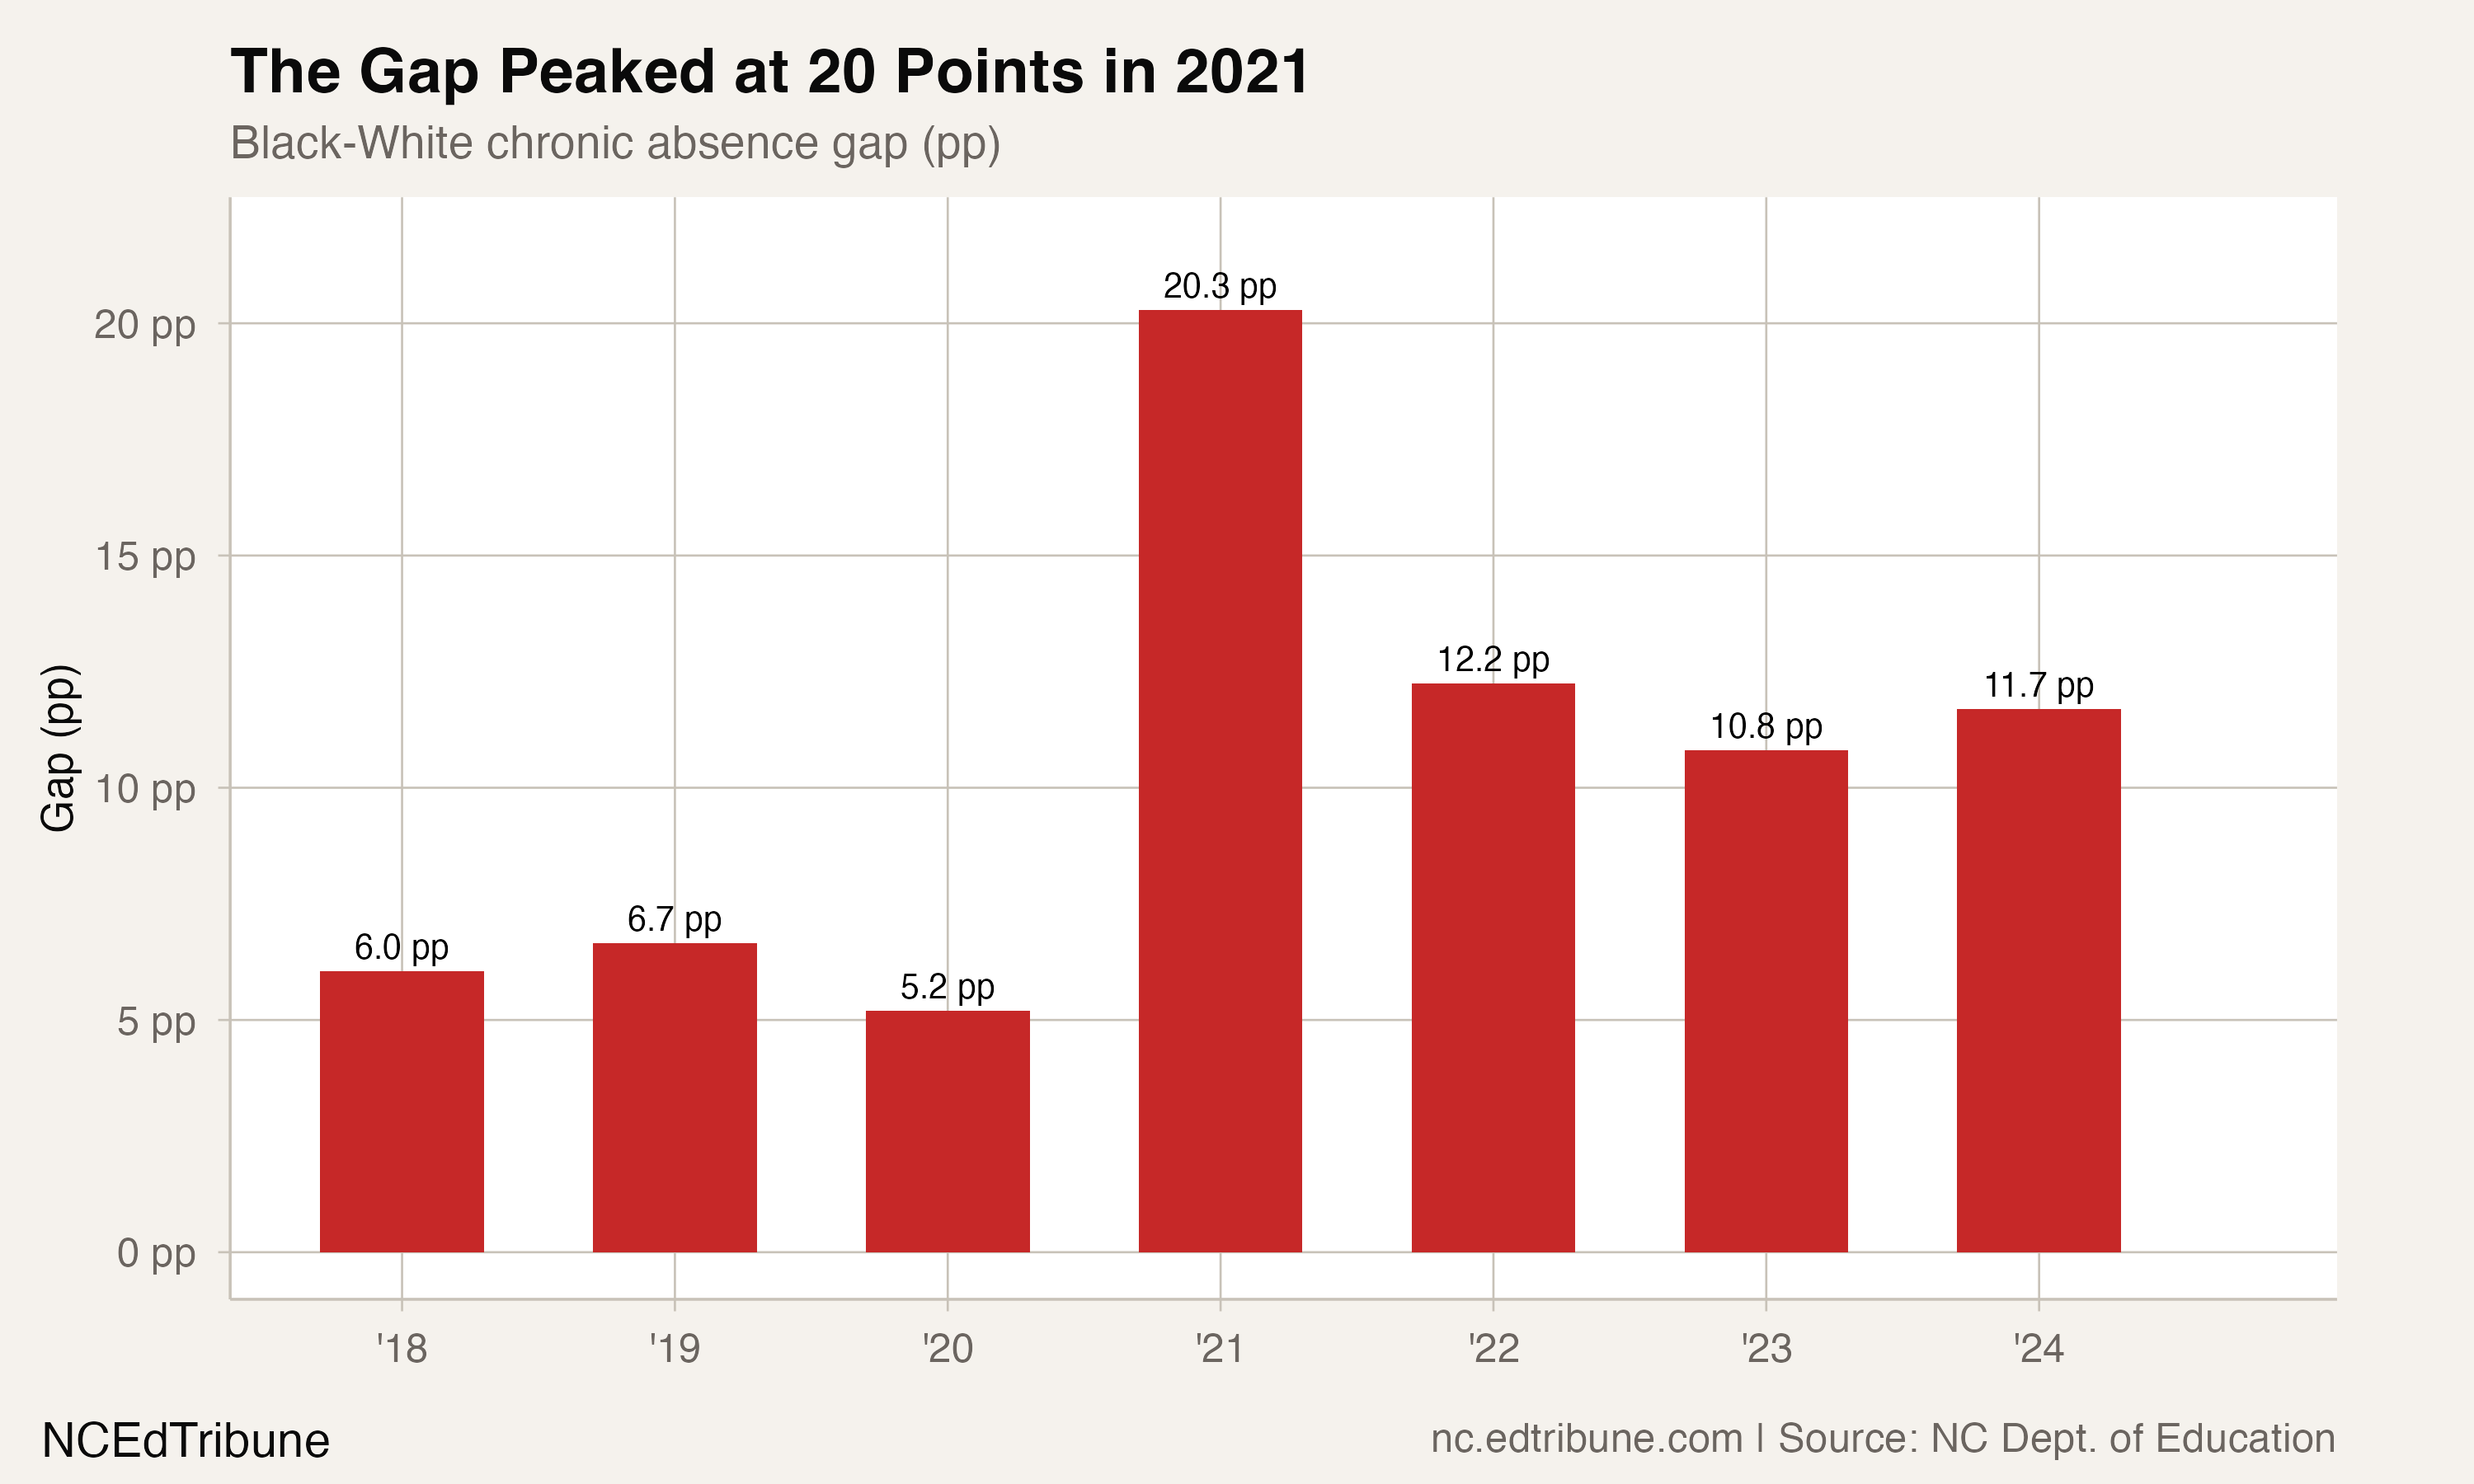
COVID did not create the gap. It existed in 2018-19 and in every prior year of available data. What COVID did was amplify it: the gap ballooned to 20.3 points during the pandemic's first full school year in 2020-21, then settled at roughly 12 points as both groups improved. The gap is now 75% wider than it was before the pandemic. Every racial equity gap in North Carolina's attendance data followed the same pattern.
The gap that did not close back
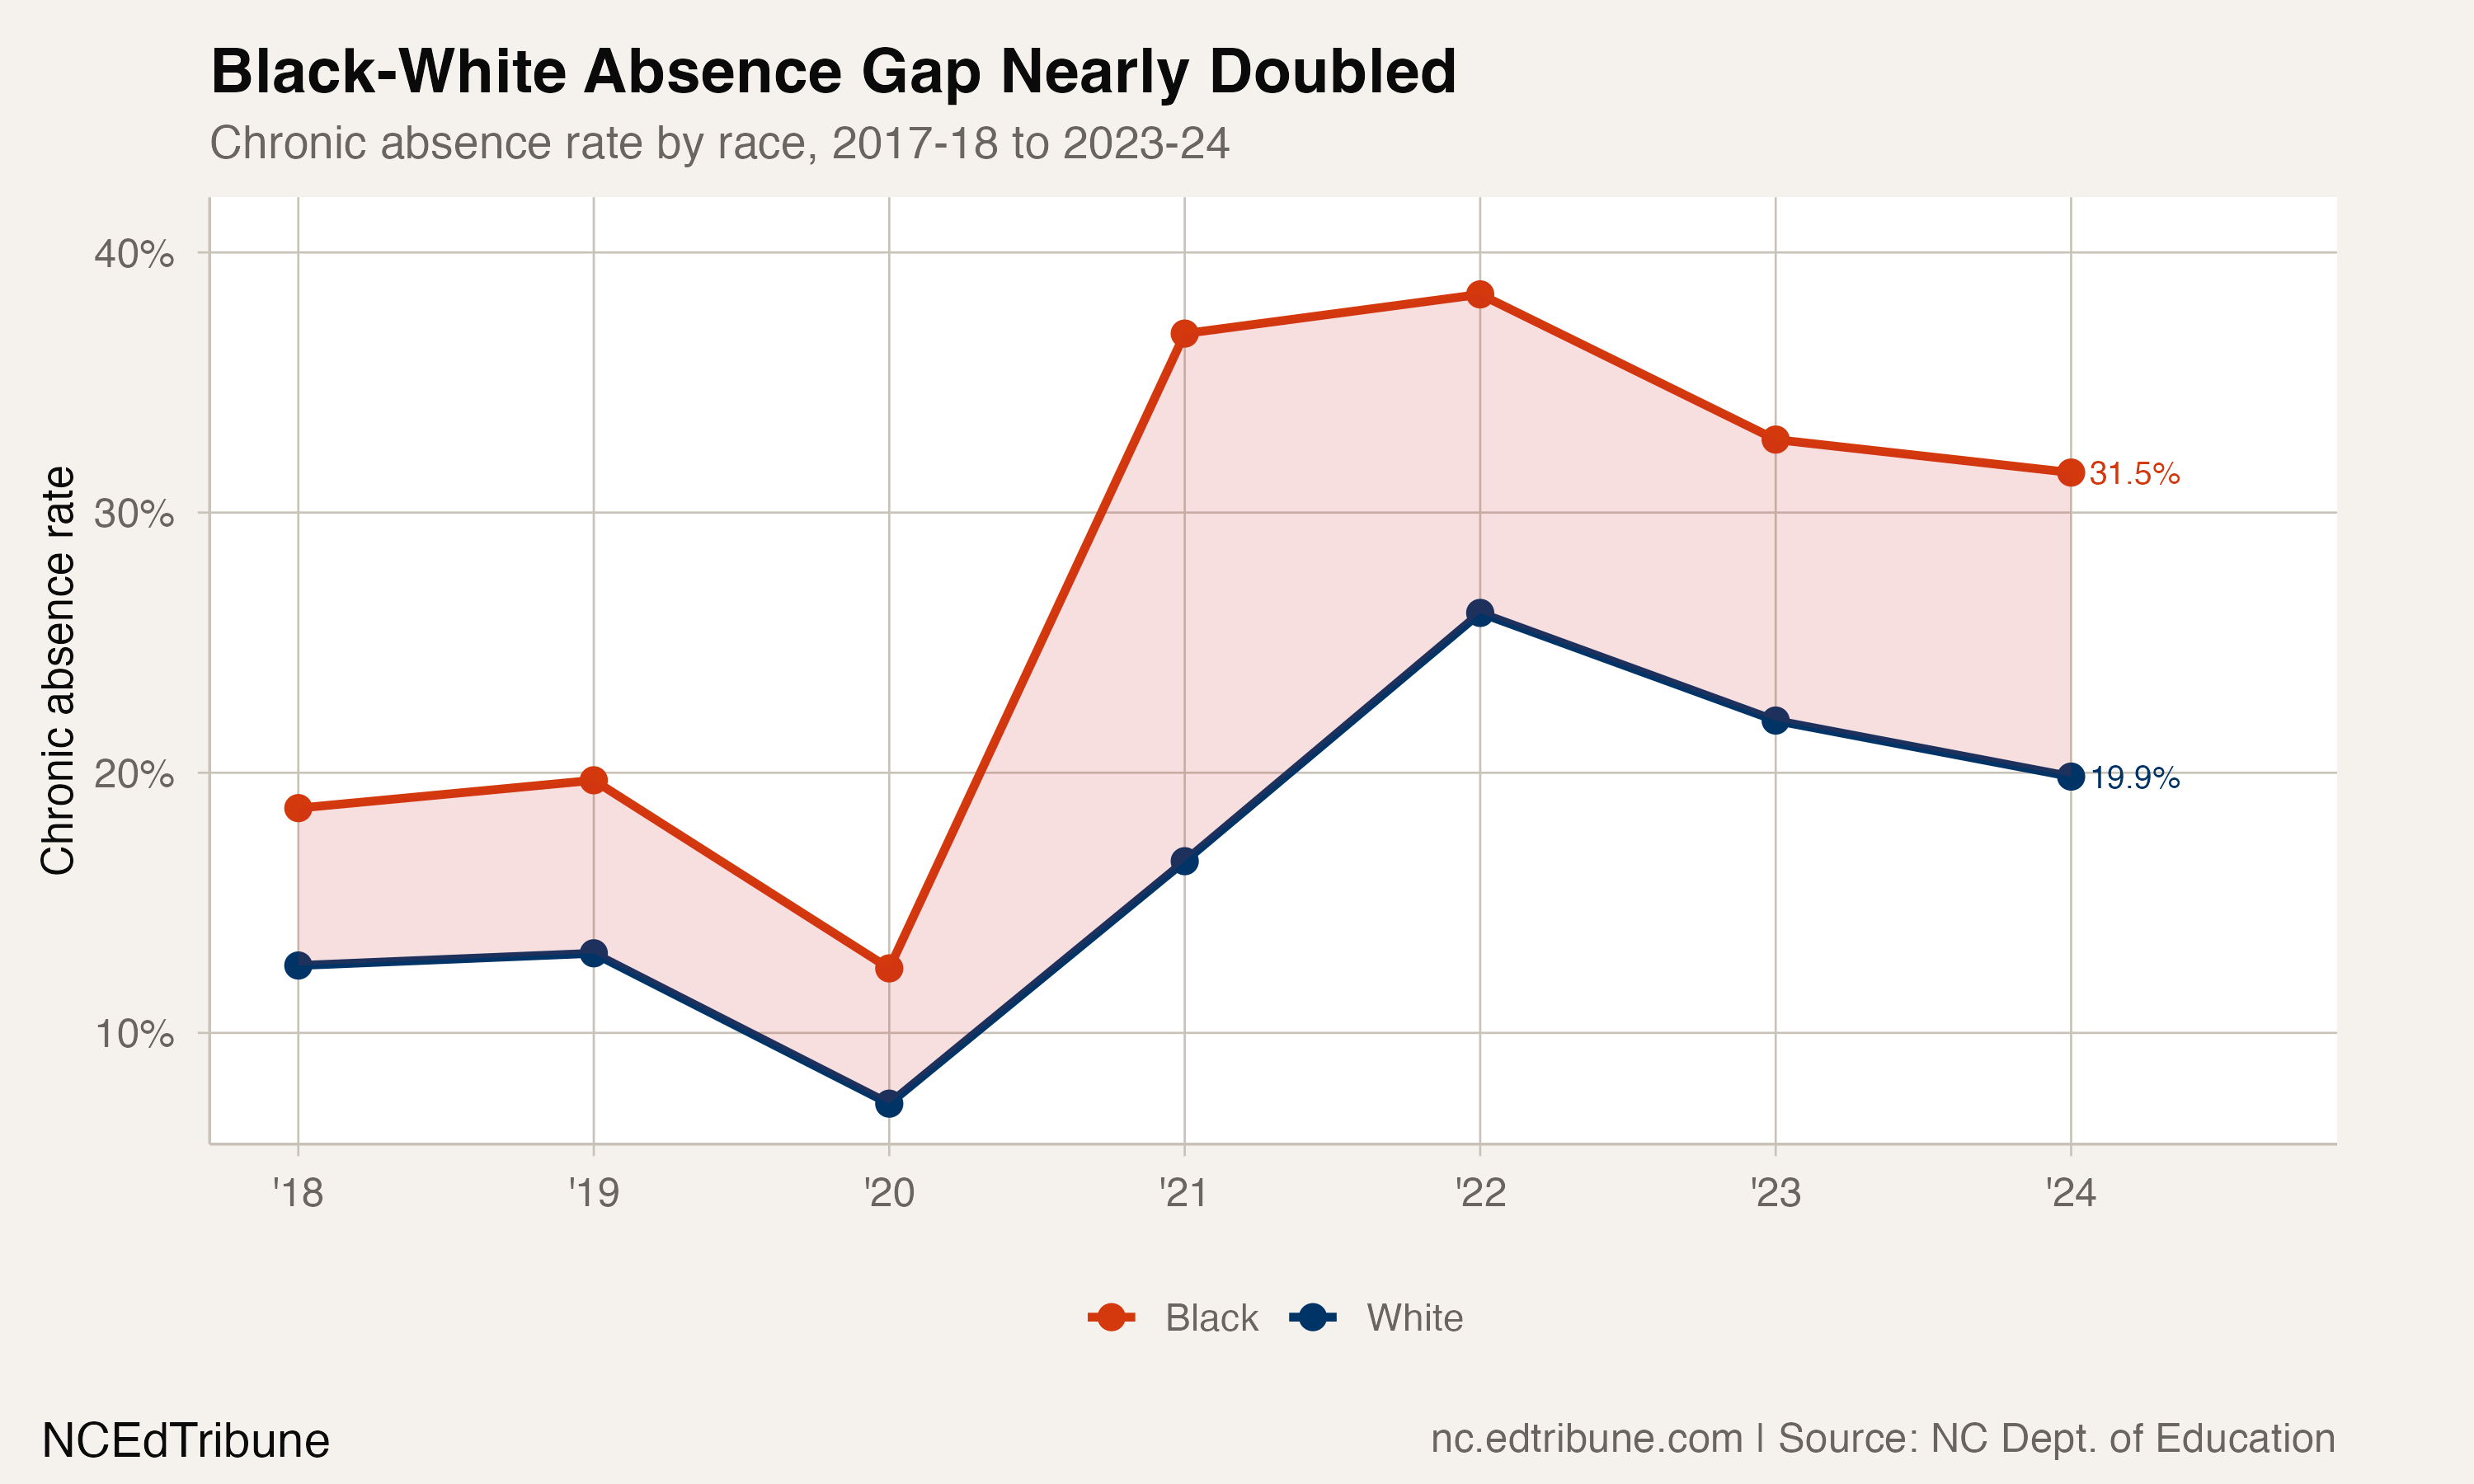
The shaded area between the two lines tells the story. In 2018-19, the last full pre-COVID year, Black students had a 19.7% chronic rate and White students 13.1%, a gap that was concerning but stable. Both groups cratered in 2020-21: Black students shot to 36.9% while White students rose to 16.6%, opening a 20.3-point chasm.
Since then, both groups have improved. But Black students have not improved faster than White students. The gap went from 20.3 points (2021) to 12.2 (2022) to 10.8 (2023) to 11.7 (2024). The recovery appears to have stalled at roughly 12 points, nearly double the pre-pandemic level.
The numbers translate to this: 121,068 Black students were chronically absent in 2023-24, out of 383,875 enrolled. Before the pandemic, the number was roughly 75,500. North Carolina's public schools have approximately 45,000 more chronically absent Black students than they did in 2018-19.
Every racial gap widened
The Black-White gap is the largest in absolute terms, but it is not the only one that widened. Every racial group's gap relative to White students expanded after COVID.
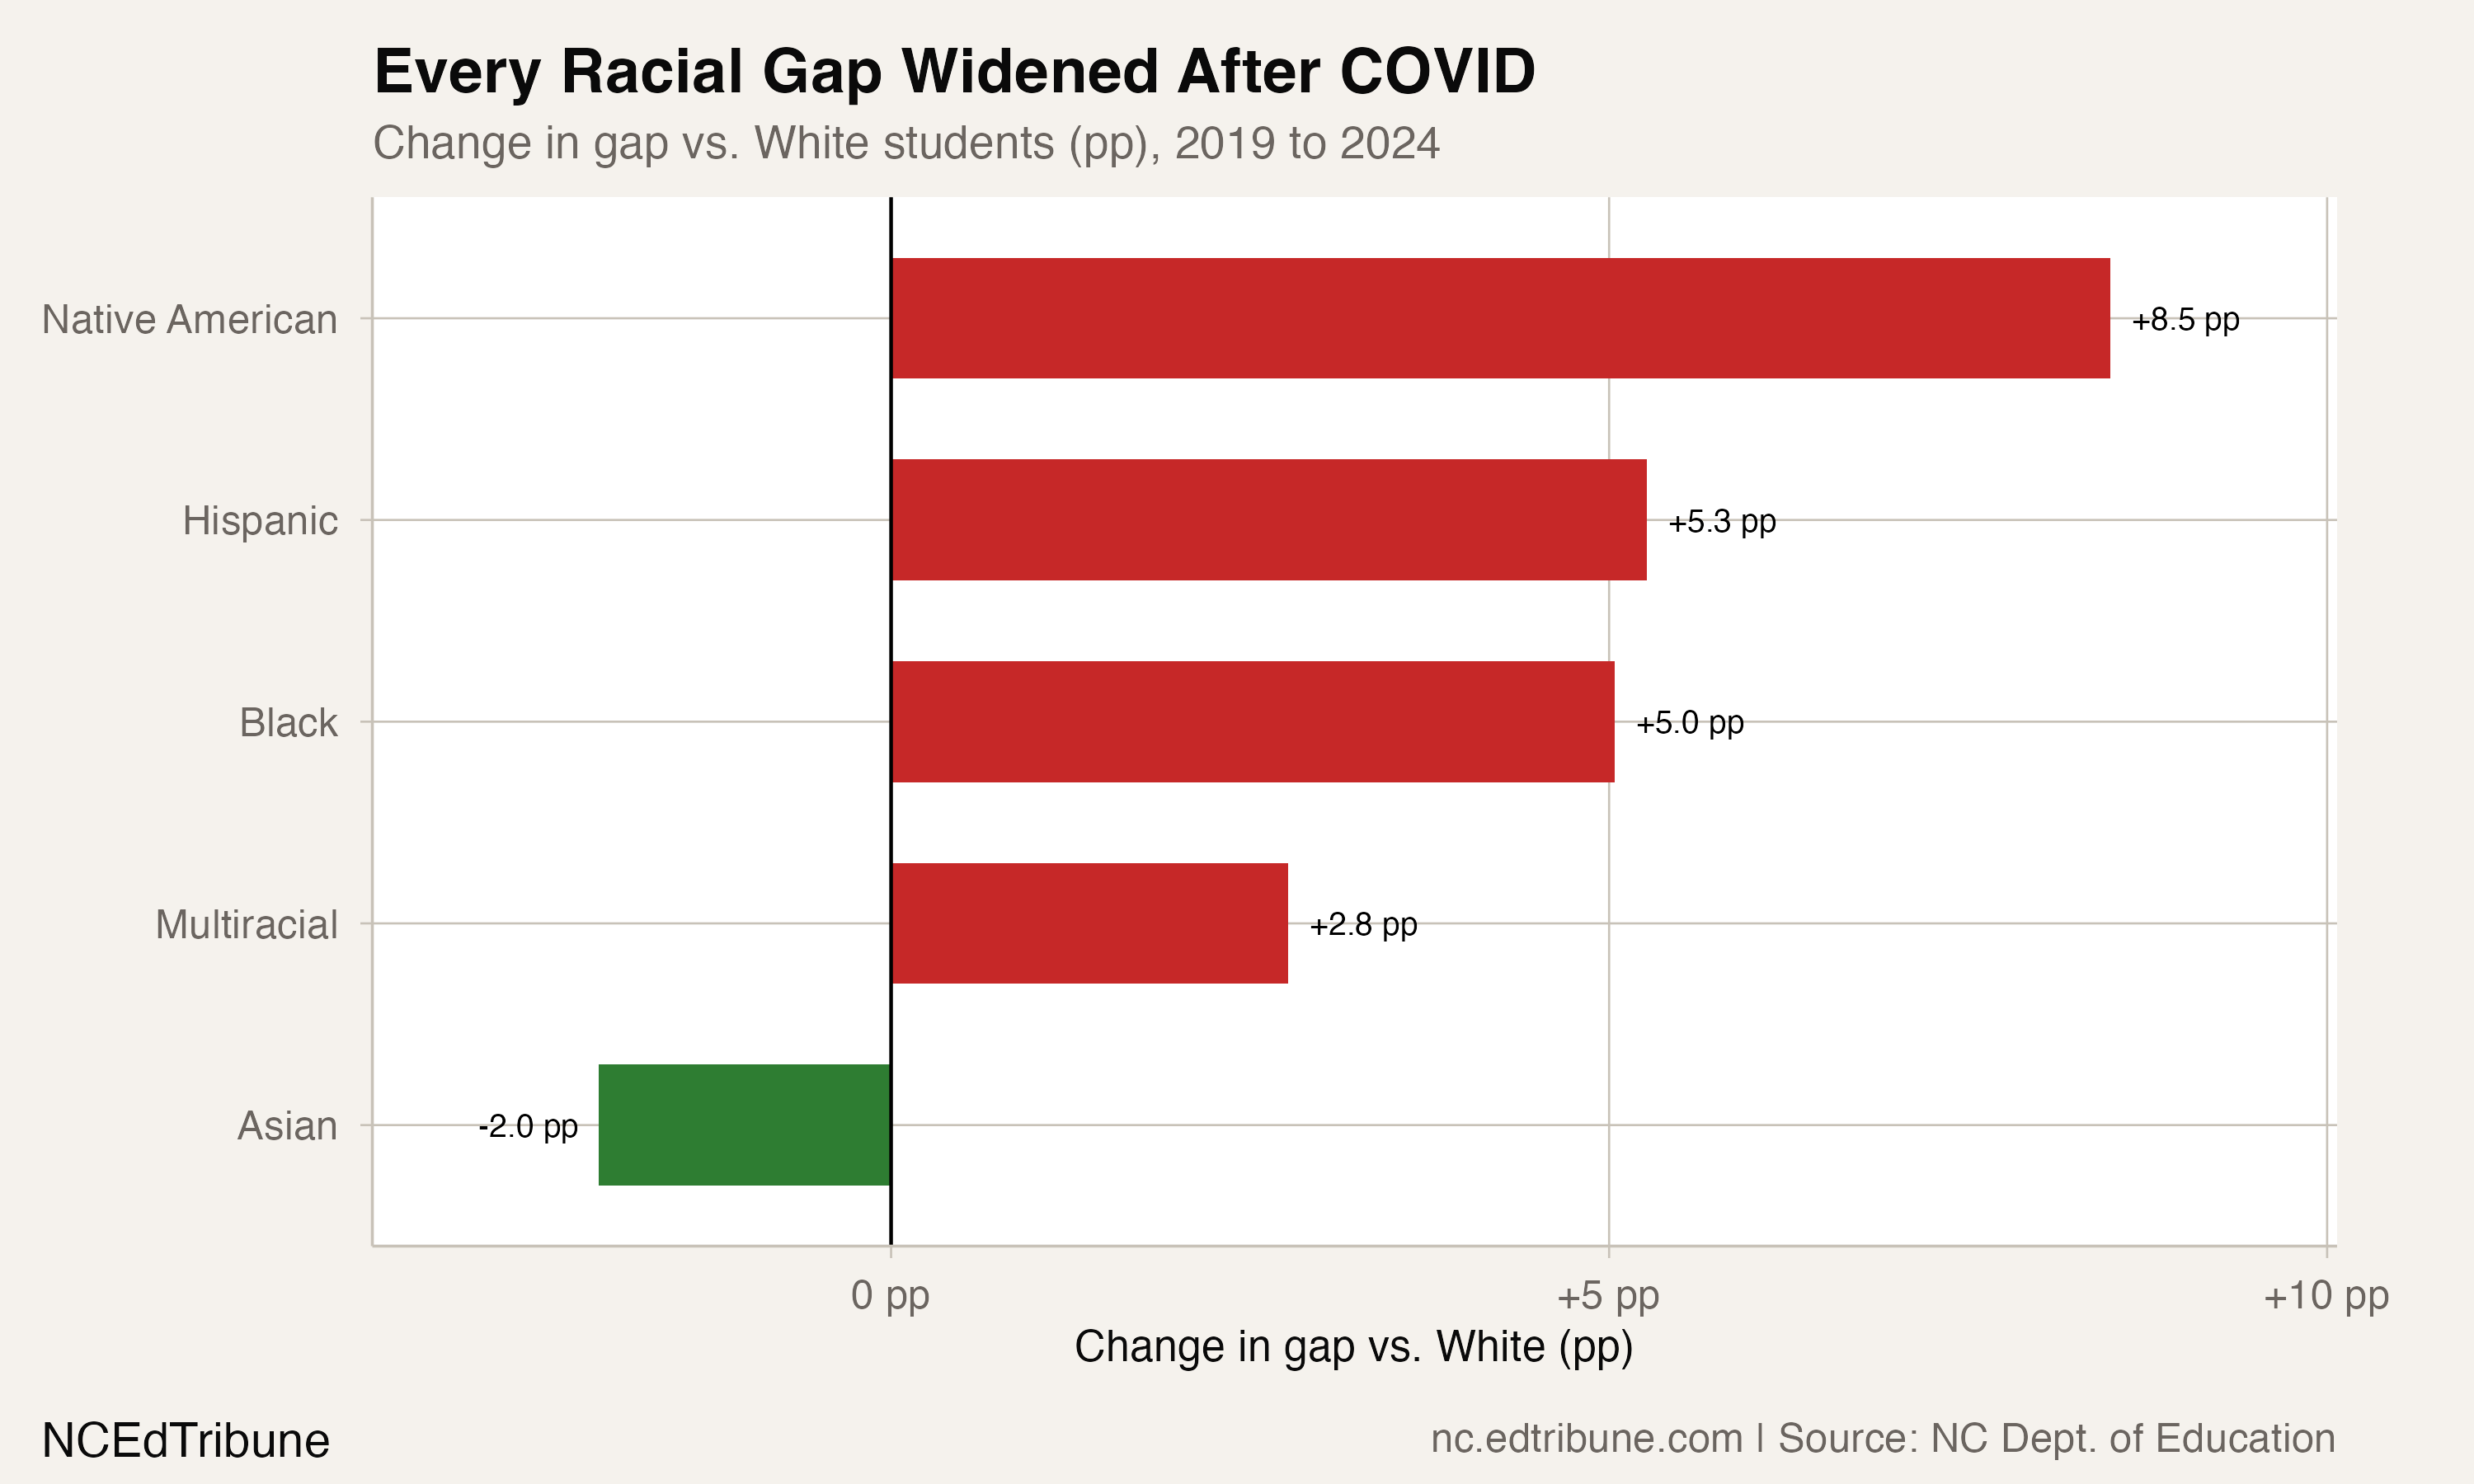
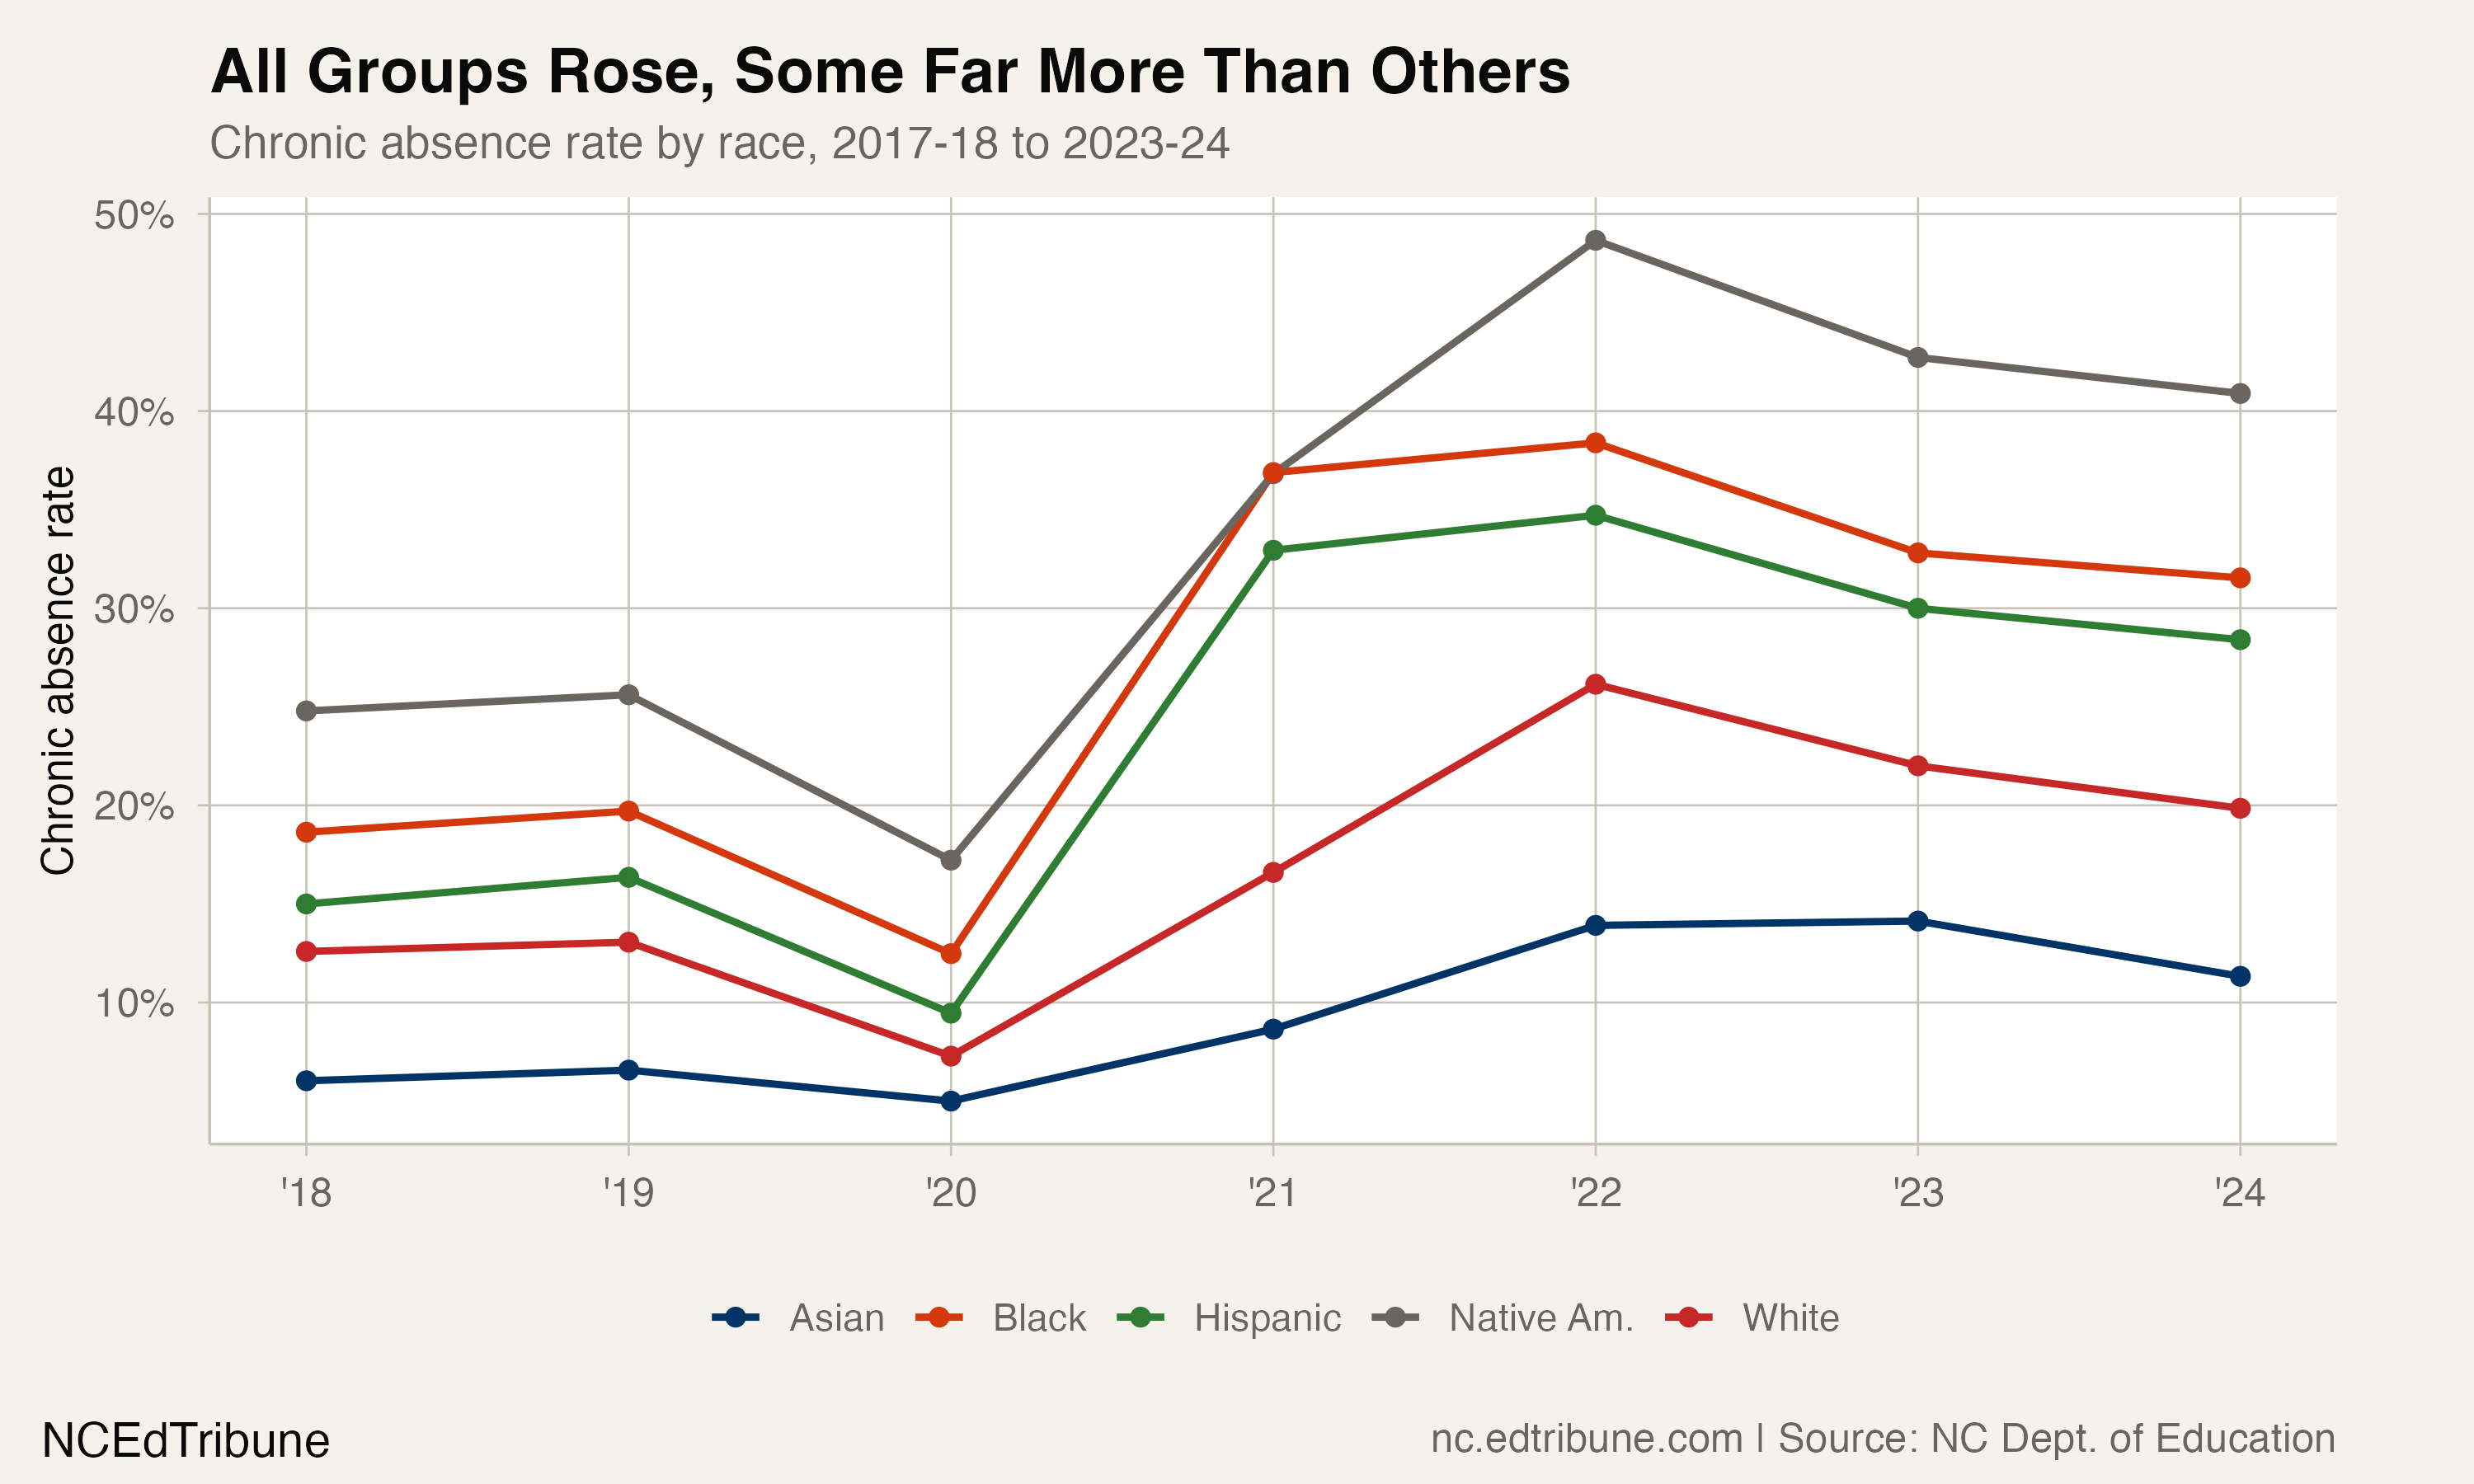
Native American students saw the largest gap expansion: 8.5 percentage points wider than before the pandemic, pushing their chronic rate to 40.9%. The Hispanic-White gap grew by 5.3 points. Multiracial students, whose pre-COVID gap of 6.5 points was similar to the Black-White gap, now sit 2.8 points wider at 9.3.
Asian students are the exception in a different direction. Their gap with White students actually grew too, but in the favorable direction: Asian chronic absence is 8.5 points below White, wider than the 6.5-point advantage they held pre-COVID. Asian students are also the closest of any group to the state's 11% target, sitting at 11.3%.
Why the recovery is uneven
The UNC EPIC research team found that 9.6% of North Carolina students were chronically absent in all three post-pandemic years, quadruple the pre-pandemic rate. The persistence of chronic absence is not distributed randomly: it concentrates among students who are Black, economically disadvantaged, or receiving special education services.
The barriers stack: transportation problems layer on top of unstable housing, which layers on top of limited access to school-based health clinics. Suspension rates, which affect Black students disproportionately, pull students out of buildings and make it harder to build the daily habit of attendance.
The state's AttendNC Counts initiative targets an 11% overall chronic rate by 2030. The data makes clear that achieving that target is impossible without dramatically narrowing the racial gap. If White chronic absence dropped to 11% while Black chronic absence stayed at 31.5%, the statewide rate would still exceed 18%. Closing the gap is not just an equity goal. It is an arithmetic prerequisite for the state's own attendance targets.
Detailed code that reproduces the analysis and figures in this article is available exclusively to EdTribune subscribers.
Discussion
Sign in to join the discussion.
Loading comments...