Correction (June 4, 2026): District totals were rebuilt from one per-district summary row after an earlier analysis double-counted enrollment. The corrected counts were seven districts at the panel high and eight with consecutive increases, rather than 55 and 46.
Correction (July 21, 2026): The package covers 2018 through 2024, so this version replaces “all-time high” with “2018-2024 panel high.” It also removes an unsupported conversion to days absent and geographic, demographic, causal, program and statewide-concentration explanations the attendance file cannot verify.
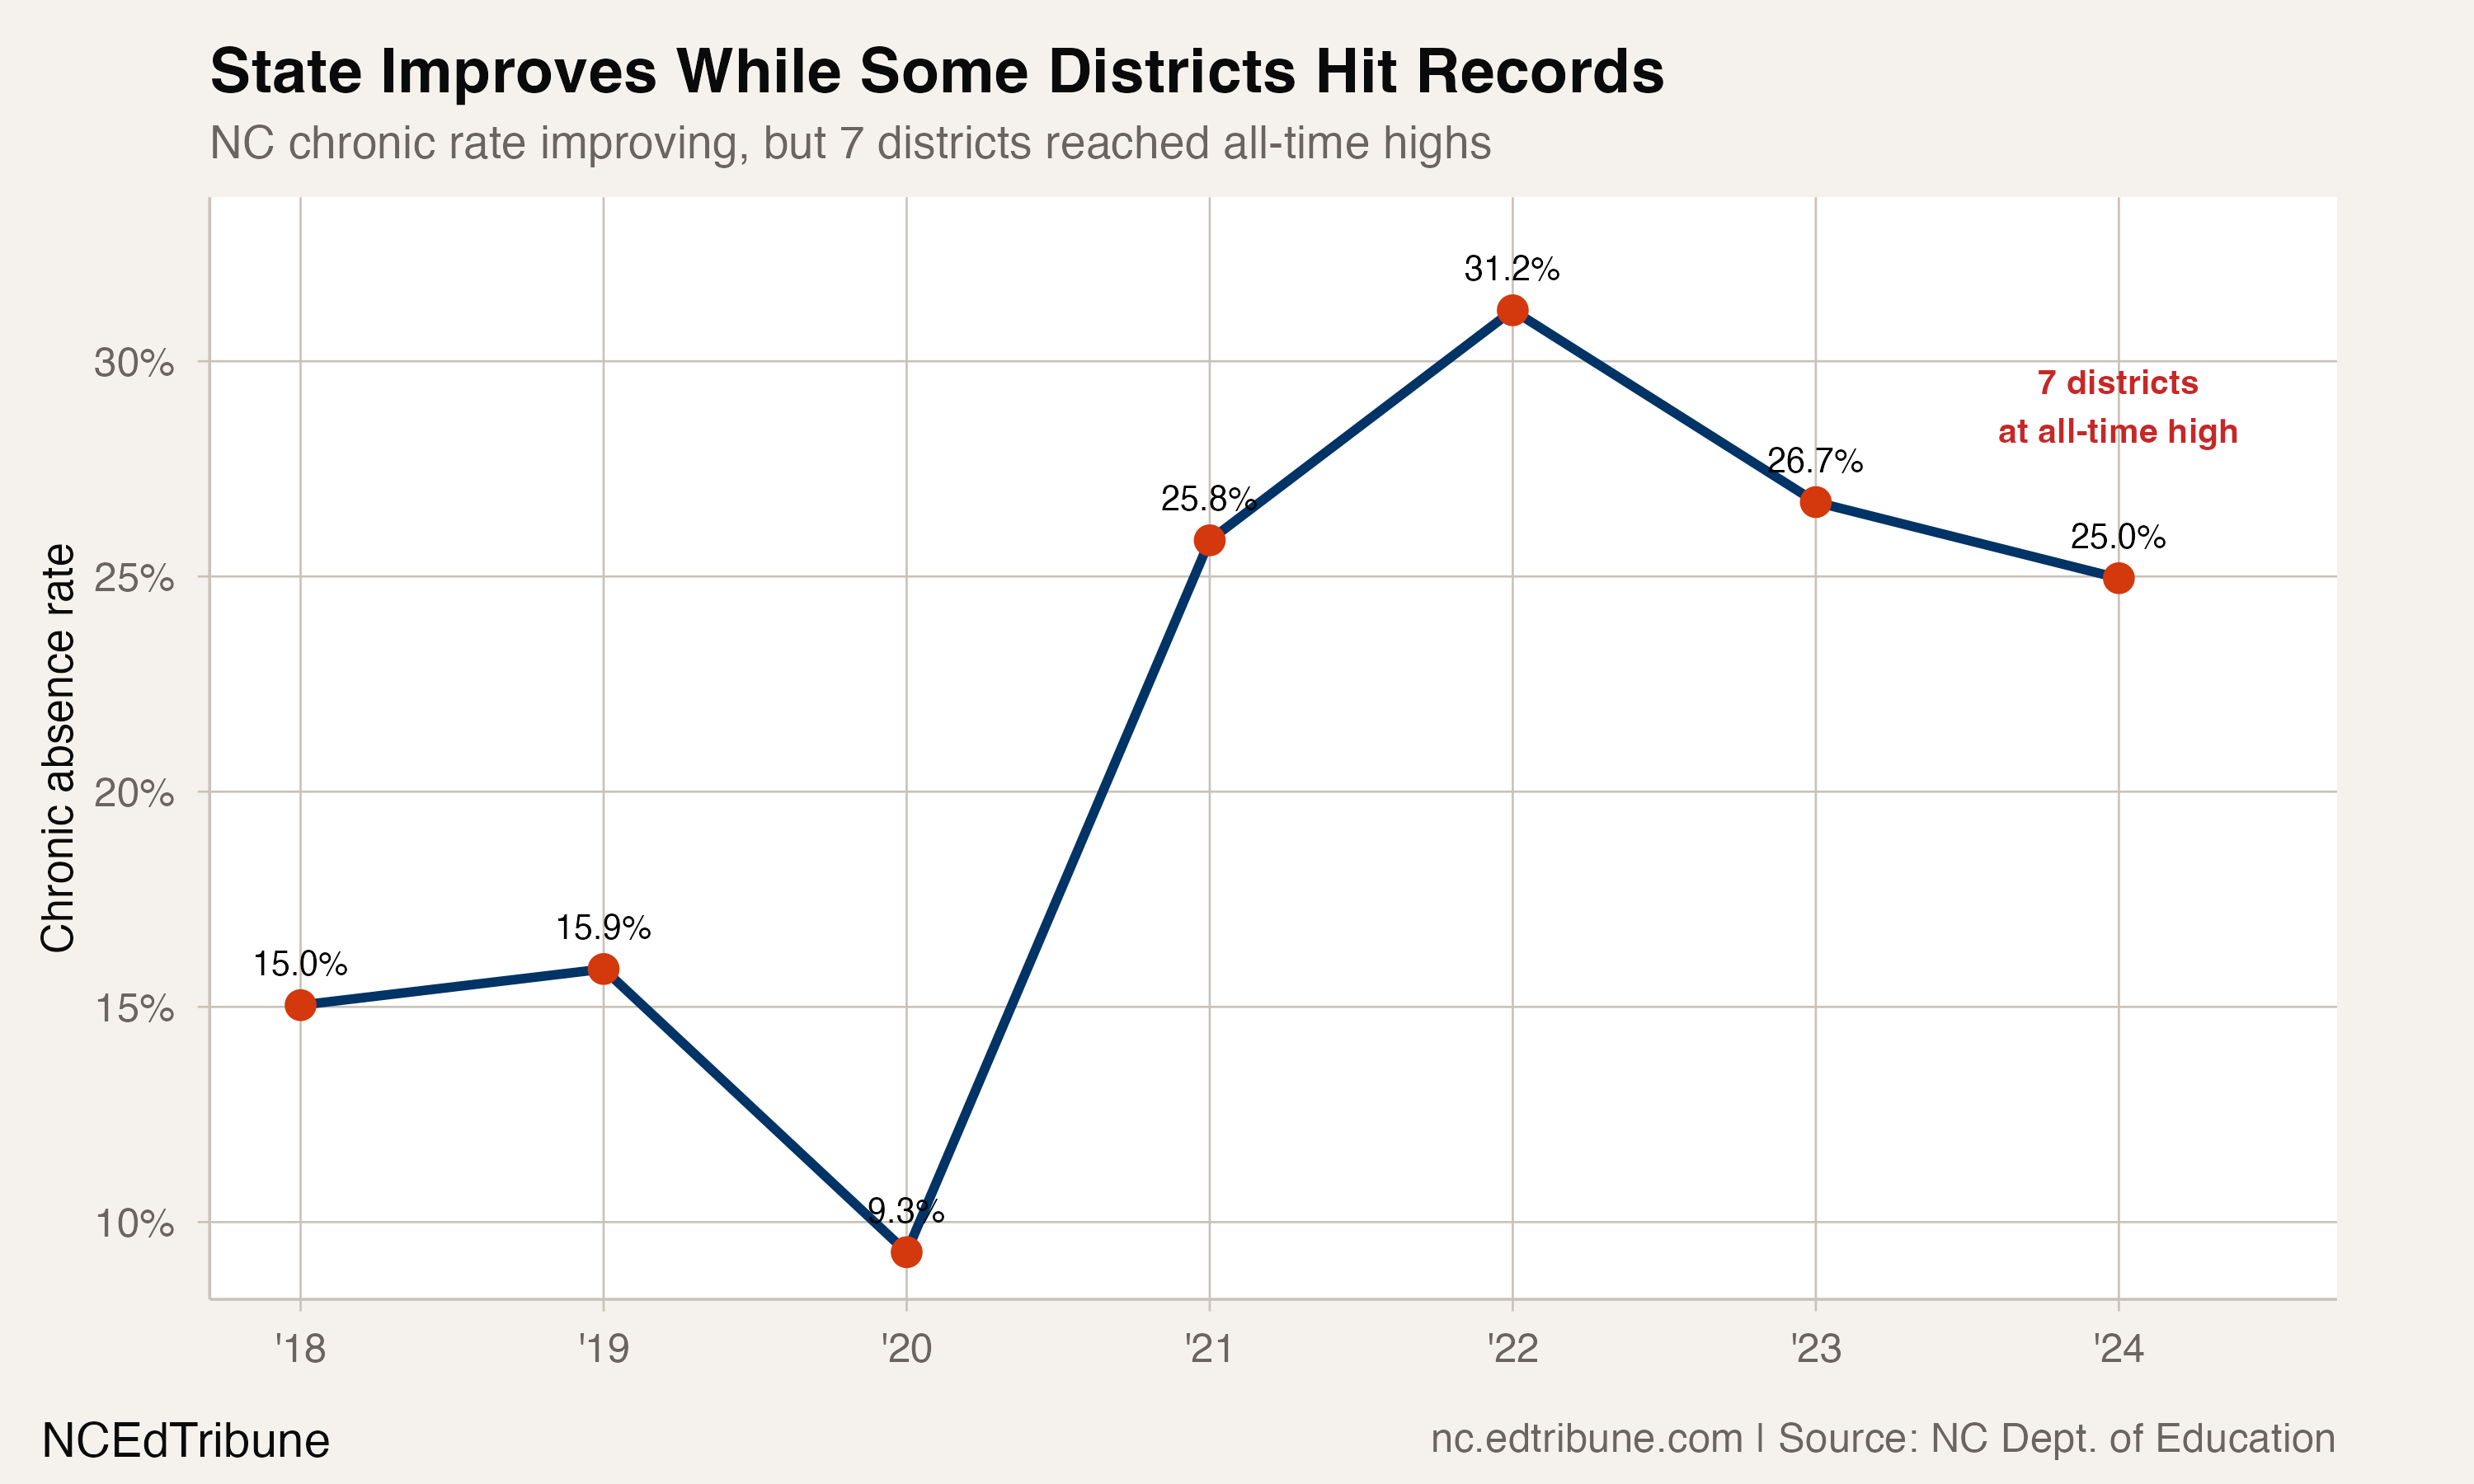
North Carolina's statewide chronic-absence rate fell from 31.2% in 2022 to 26.7% in 2023 and 25.0% in 2024. During that two-year statewide improvement, seven eligible districts recorded their highest rate in the package's 2018-2024 panel in 2024.
The district test includes systems with at least 200 enrolled students, at least three observed years and no missing rate within their observed panel. Eight districts also posted consecutive increases from 2022 to 2023 and from 2023 to 2024.
Seven district panel highs
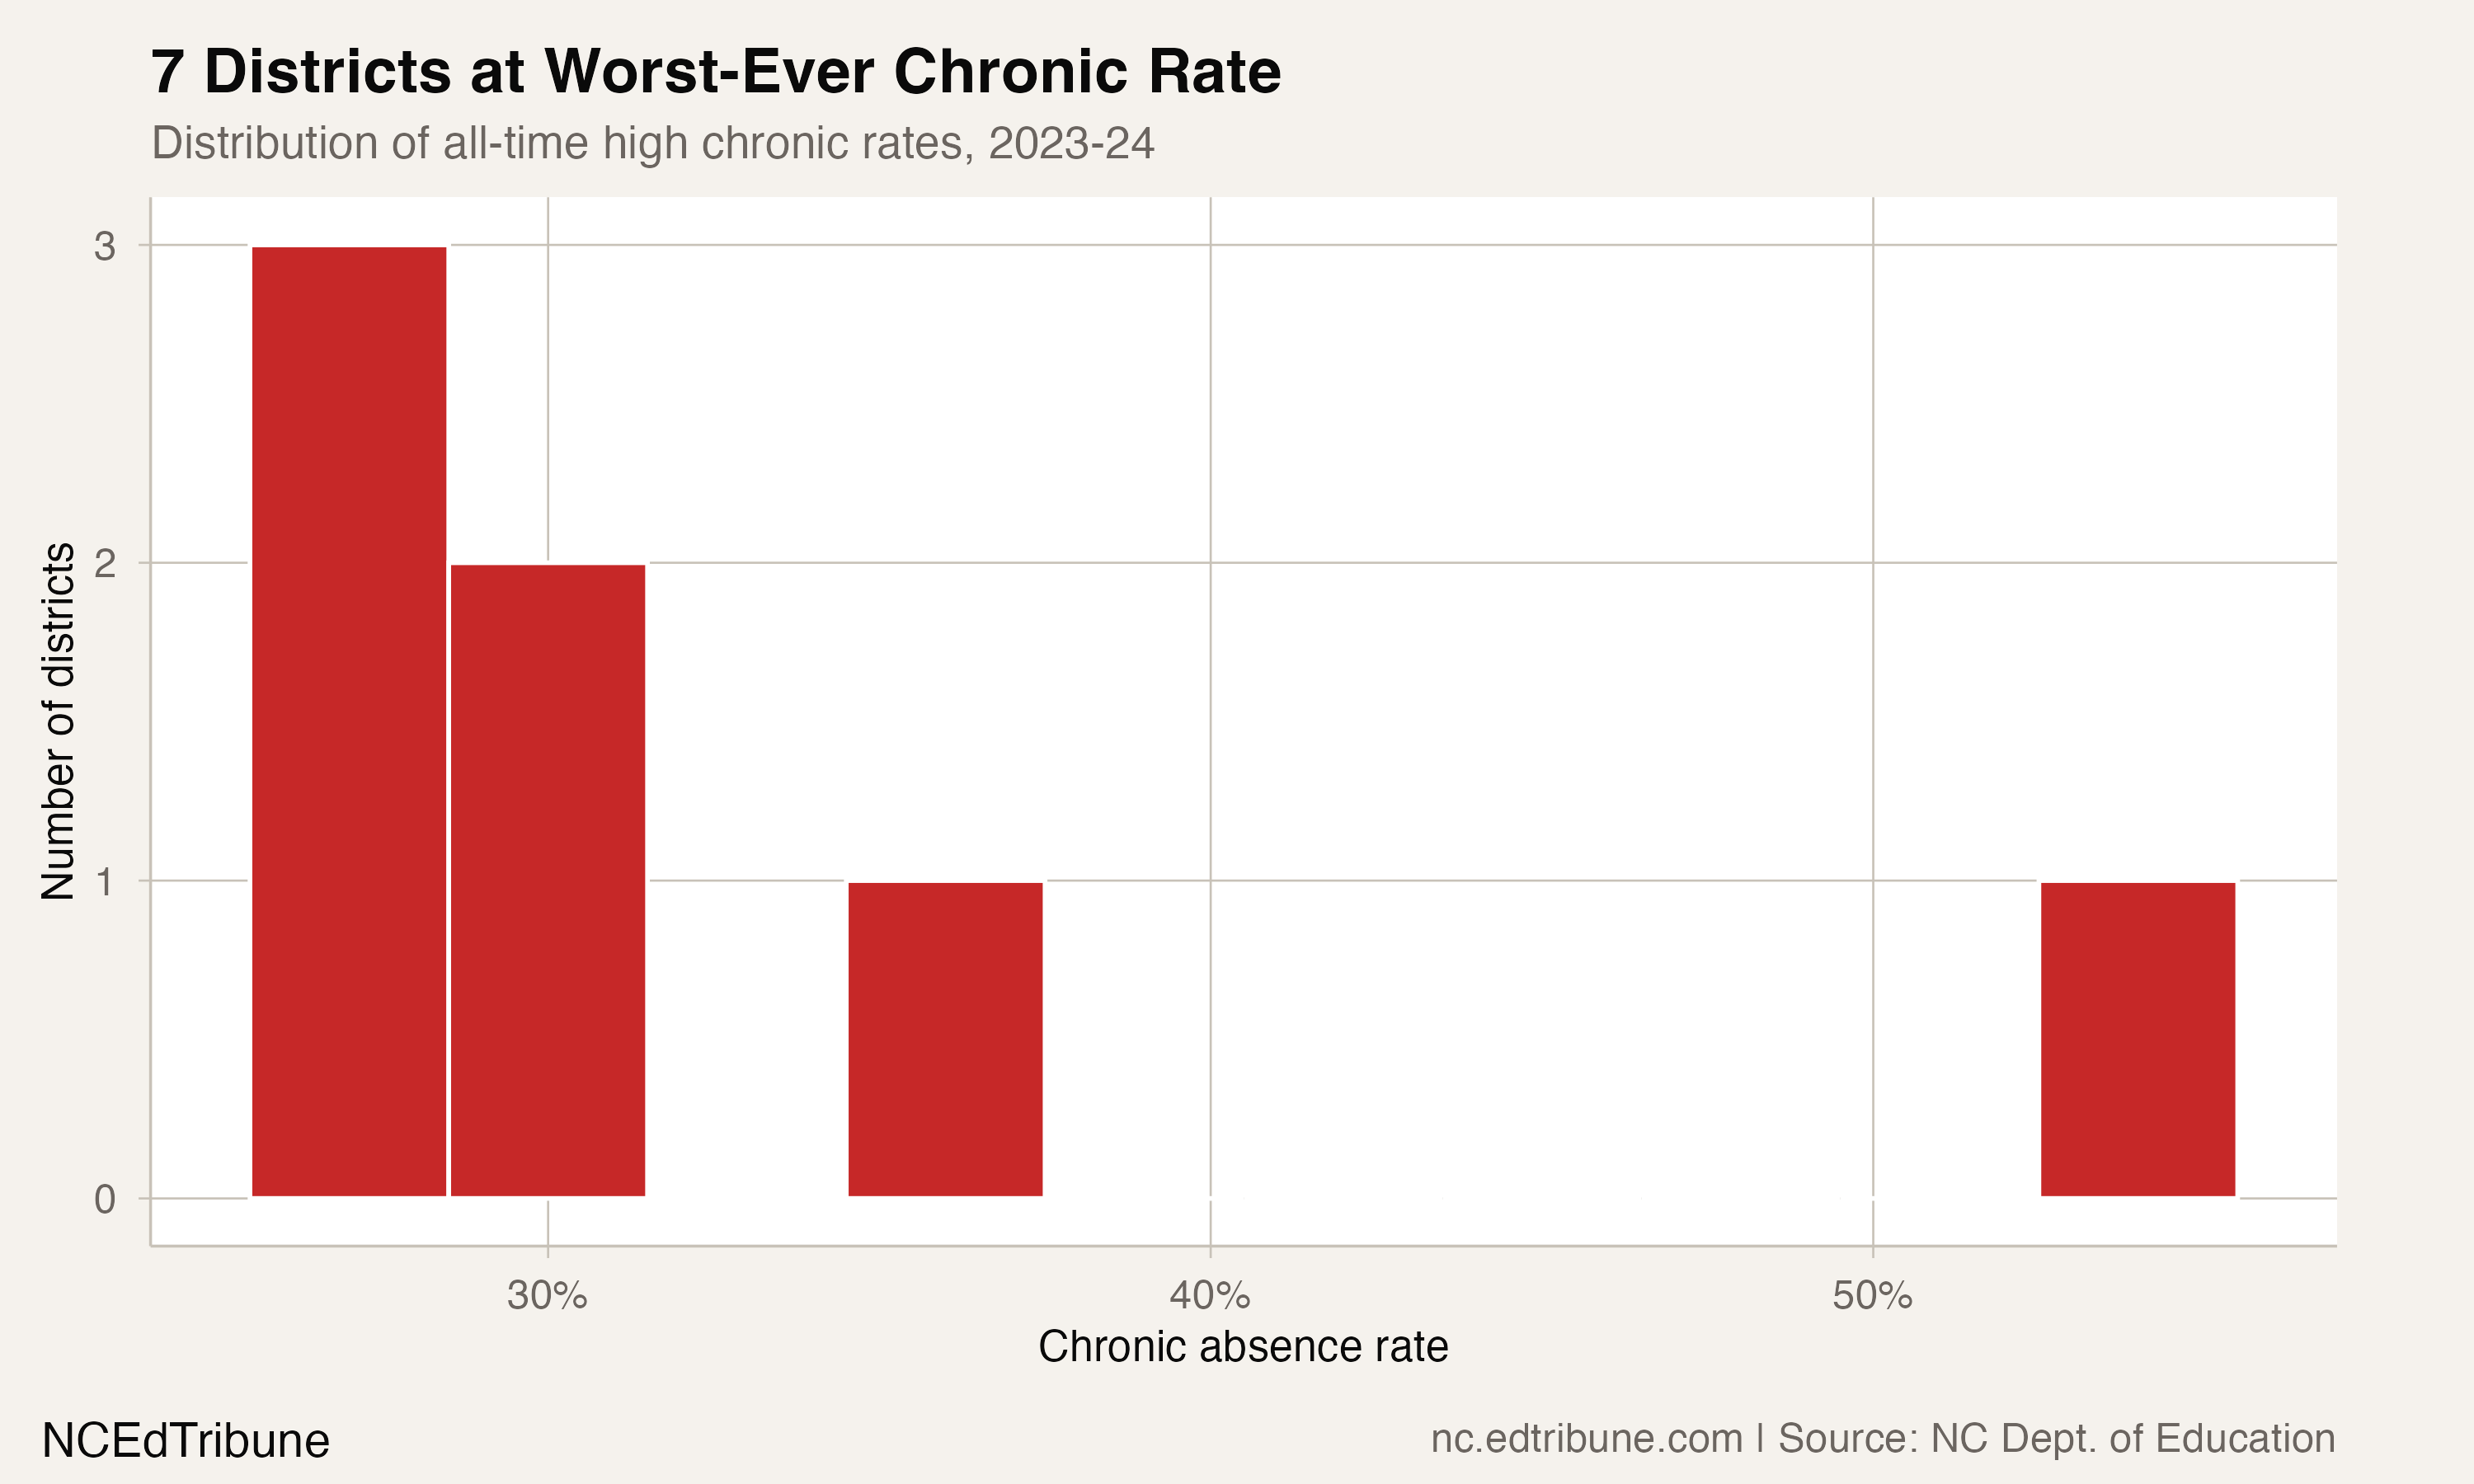
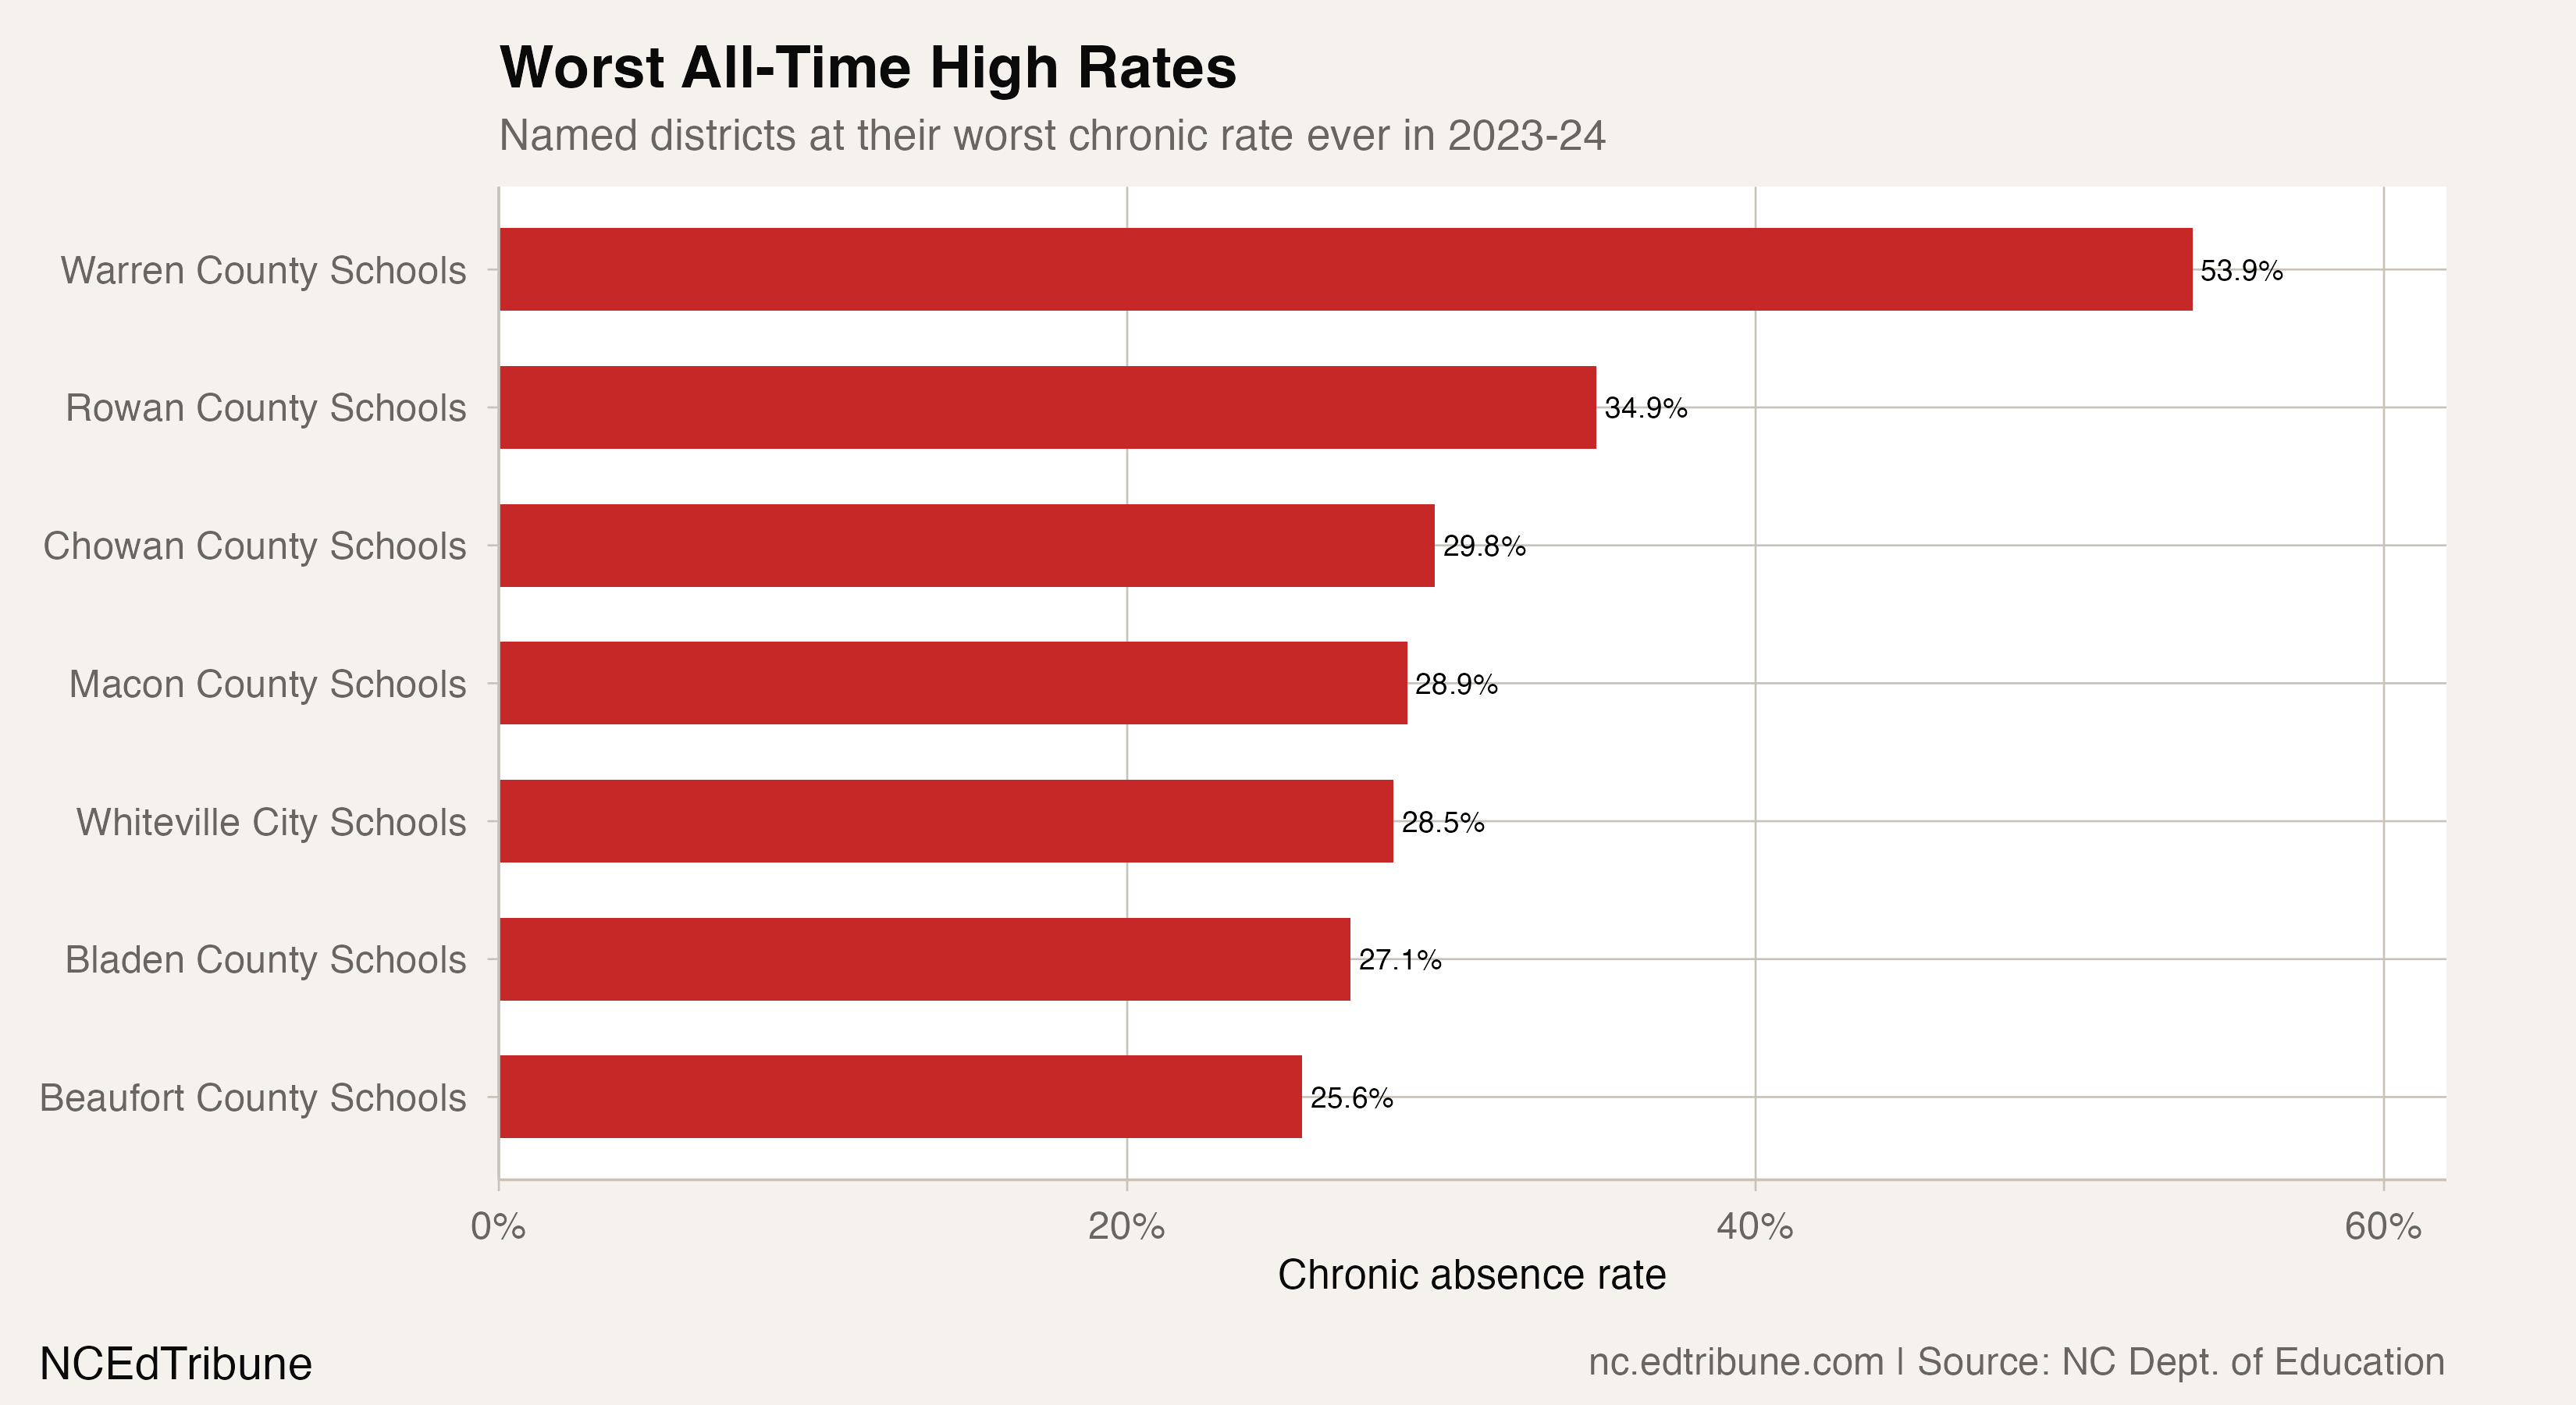
The seven 2024 panel-high rates ranged from 25.6% to 53.9%. Warren County Schools had the highest rate, 53.9%, with 1,718 enrolled students. Rowan County Schools had a 34.9% rate and 19,008 students.
The other five were Chowan County Schools at 29.8% with 1,843 students; Macon County Schools at 28.9% with 4,594; Whiteville City Schools at 28.5% with 2,135; Bladen County Schools at 27.1% with 4,098; and Beaufort County Schools at 25.6% with 5,874.
Consecutive increases
The eight-district worsening group is defined separately: each district had complete 2022, 2023 and 2024 rows, at least 200 students, and a higher rate in both annual transitions. Six of those eight districts were also among the seven at their panel high in 2024.
That divergence does not show where the statewide improvement was concentrated or why individual district rates changed. The package does not test poverty, healthcare access, transportation, program effects or other mechanisms, and it does not provide the instructional-day denominator needed to convert chronic absence into a single exact number of missed days.
Detailed code that reproduces the analysis and figures in this article is available exclusively to EdTribune subscribers.
Discussion
Sign in to join the discussion.
Loading comments...