Correction (April 22, 2026, updated May 13, 2026): An earlier version of this article double-counted enrollment and chronic absence figures due to a data processing error. All absolute counts have been corrected. Several subgroup rates have also been resynced to the corrected data; differences are within one percentage point.
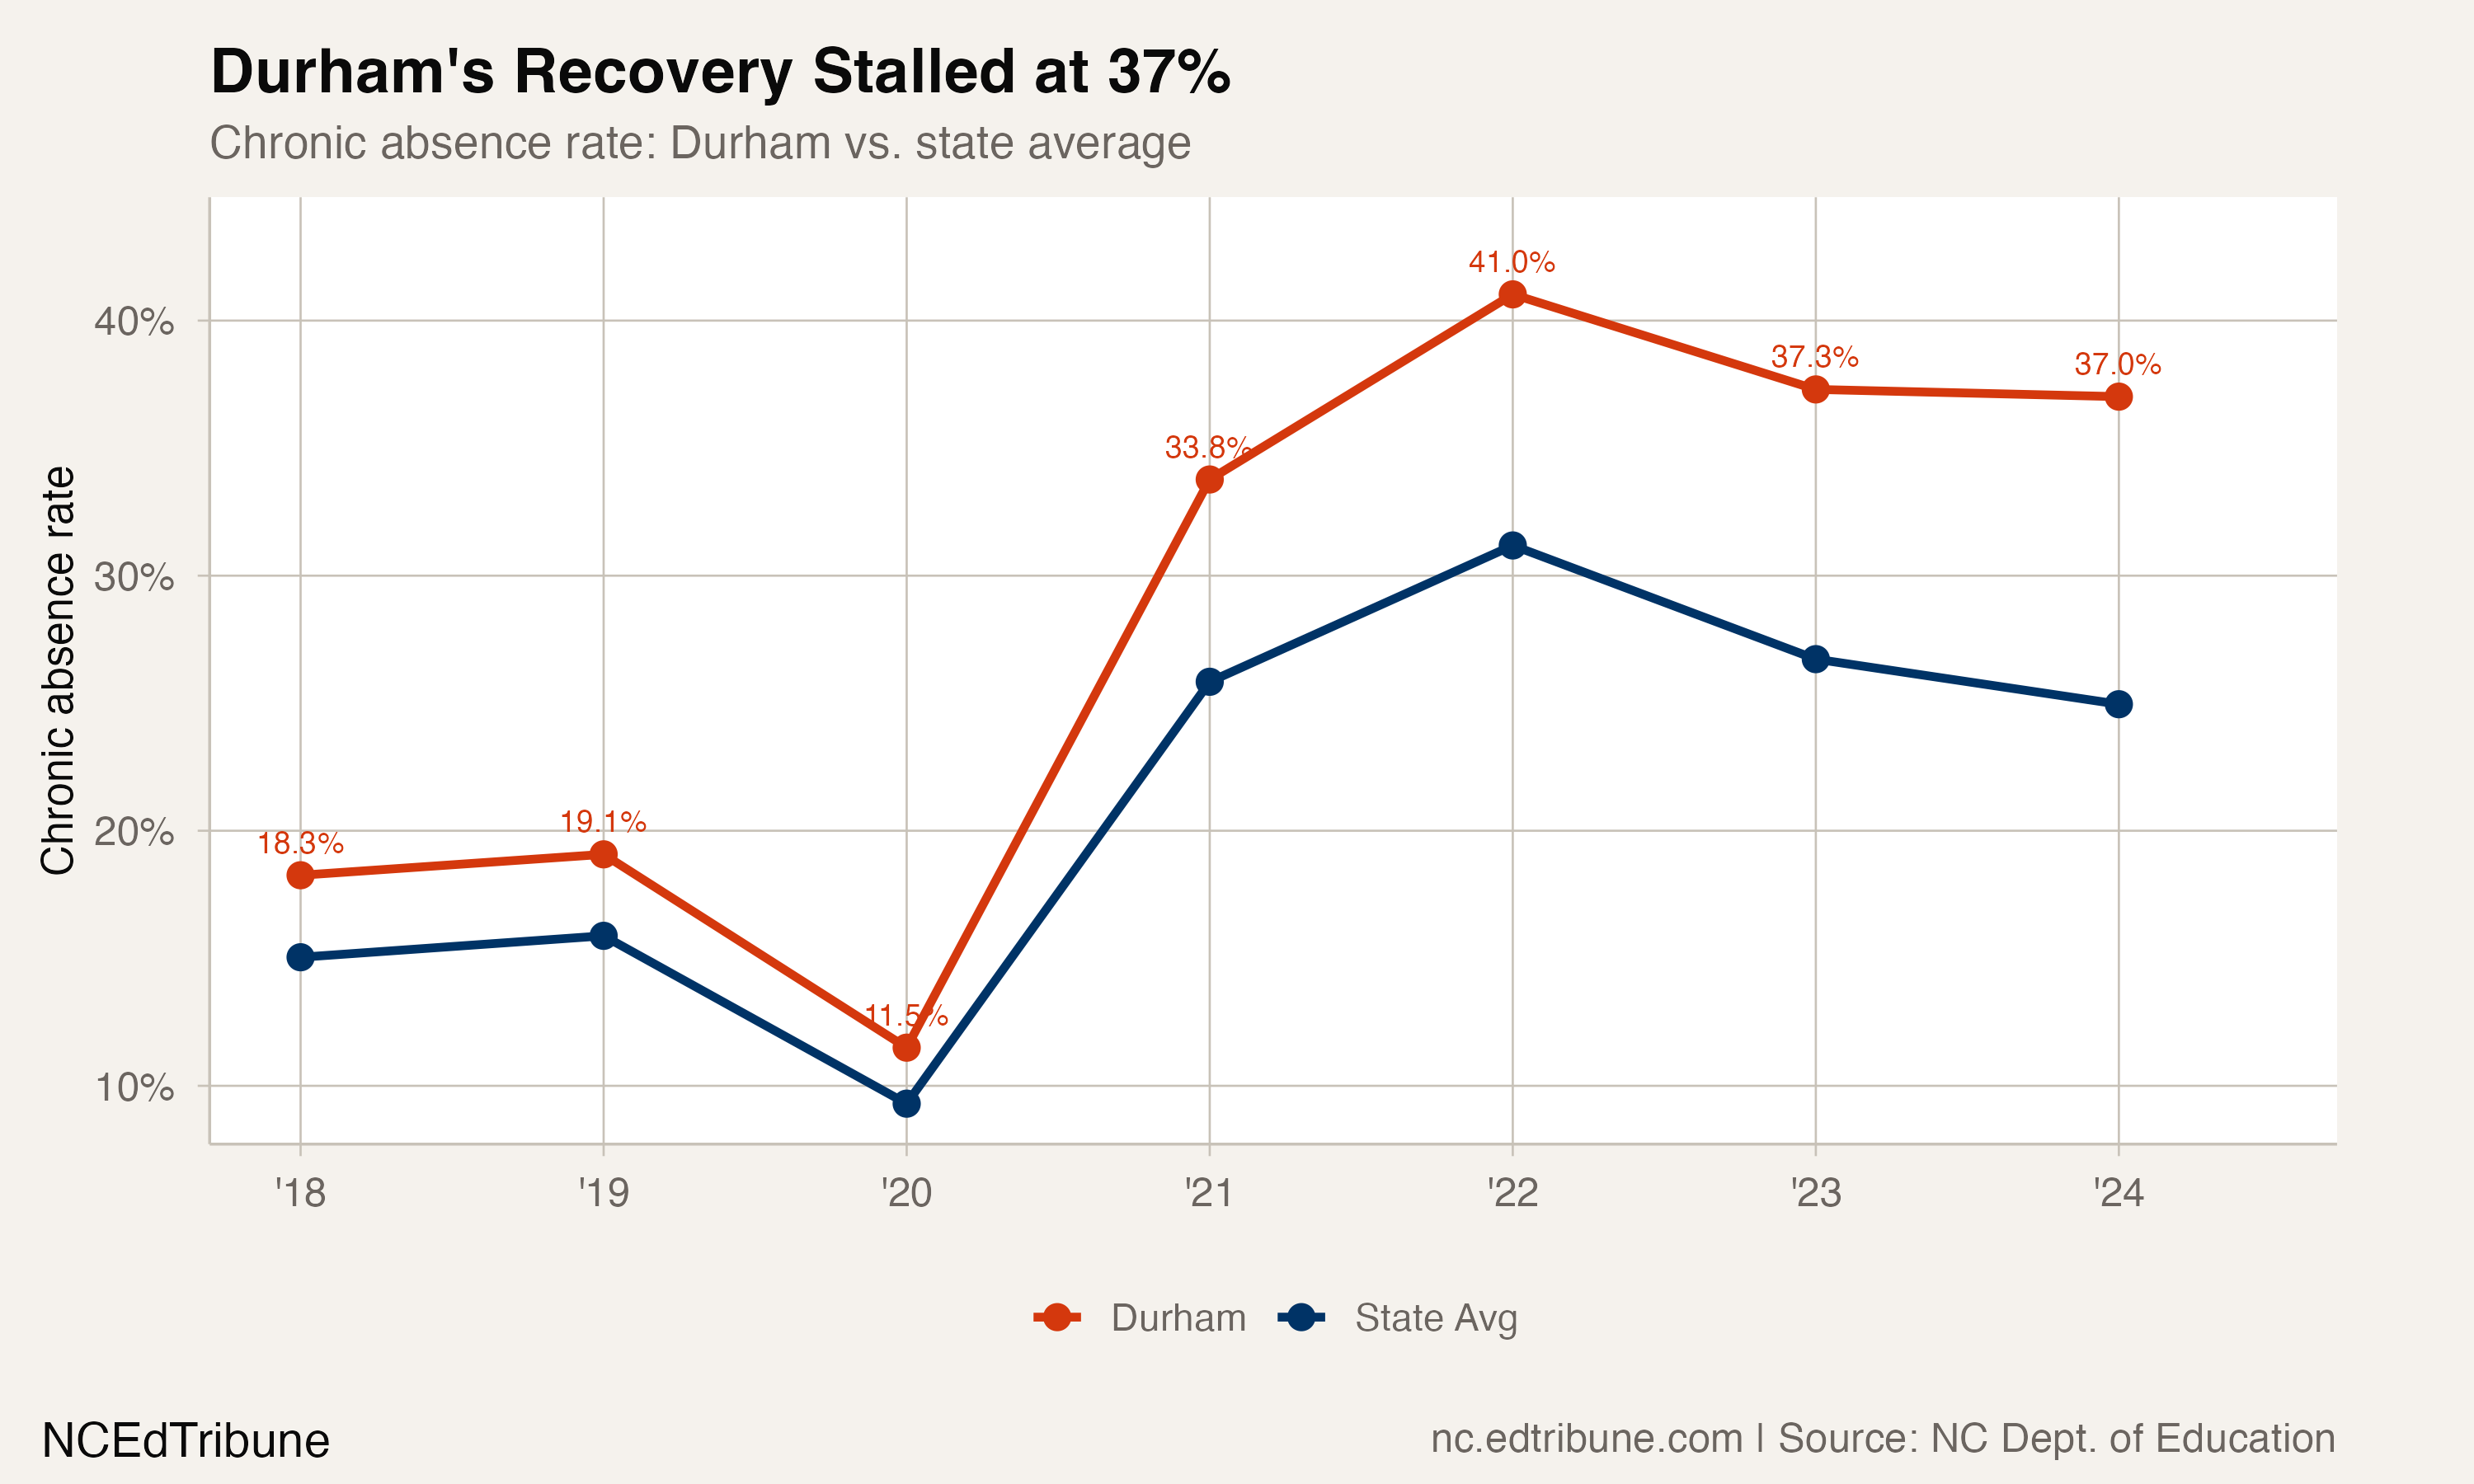
Durham Public Schools went from a 41.2% chronic absence peak in 2021-22 to 37.3% in 2022-23. Then something stopped. In 2023-24, the rate was 37.2%, a 0.2-point change from the year before. That is statistically indistinguishable from flat. The recovery, such as it was, appears to have ended.
The stall leaves Durham with the highest chronic absence rate among all North Carolina districts with 30,000 or more students. Its 37.2% rate is more than 12 points above the state average and nearly double its pre-COVID rate of 18.8%. Of the district's 33,175 students, 12,329 were chronically absent, missing at least 18 days.
The half-point plateau
The difference between recovery and stall shows up clearly in the year-over-year numbers. From 2022 to 2023, Durham dropped 3.8 points. From 2023 to 2024, it dropped 0.2. The state as a whole continued to improve, dropping 1.8 points over the same period. Durham's gap with the state average actually widened, from 10.6 points to 12.2.
The implication is that Durham captured the "easy" recoveries in 2022-23, students who simply returned to their pre-pandemic attendance habits, and is now left with a population of students who are chronically absent and whose barriers are more persistent. Roughly 12,300 students are still missing at least 18 days per year, and whatever interventions the district deployed last year did not meaningfully reduce that number.
Highest rate among large districts
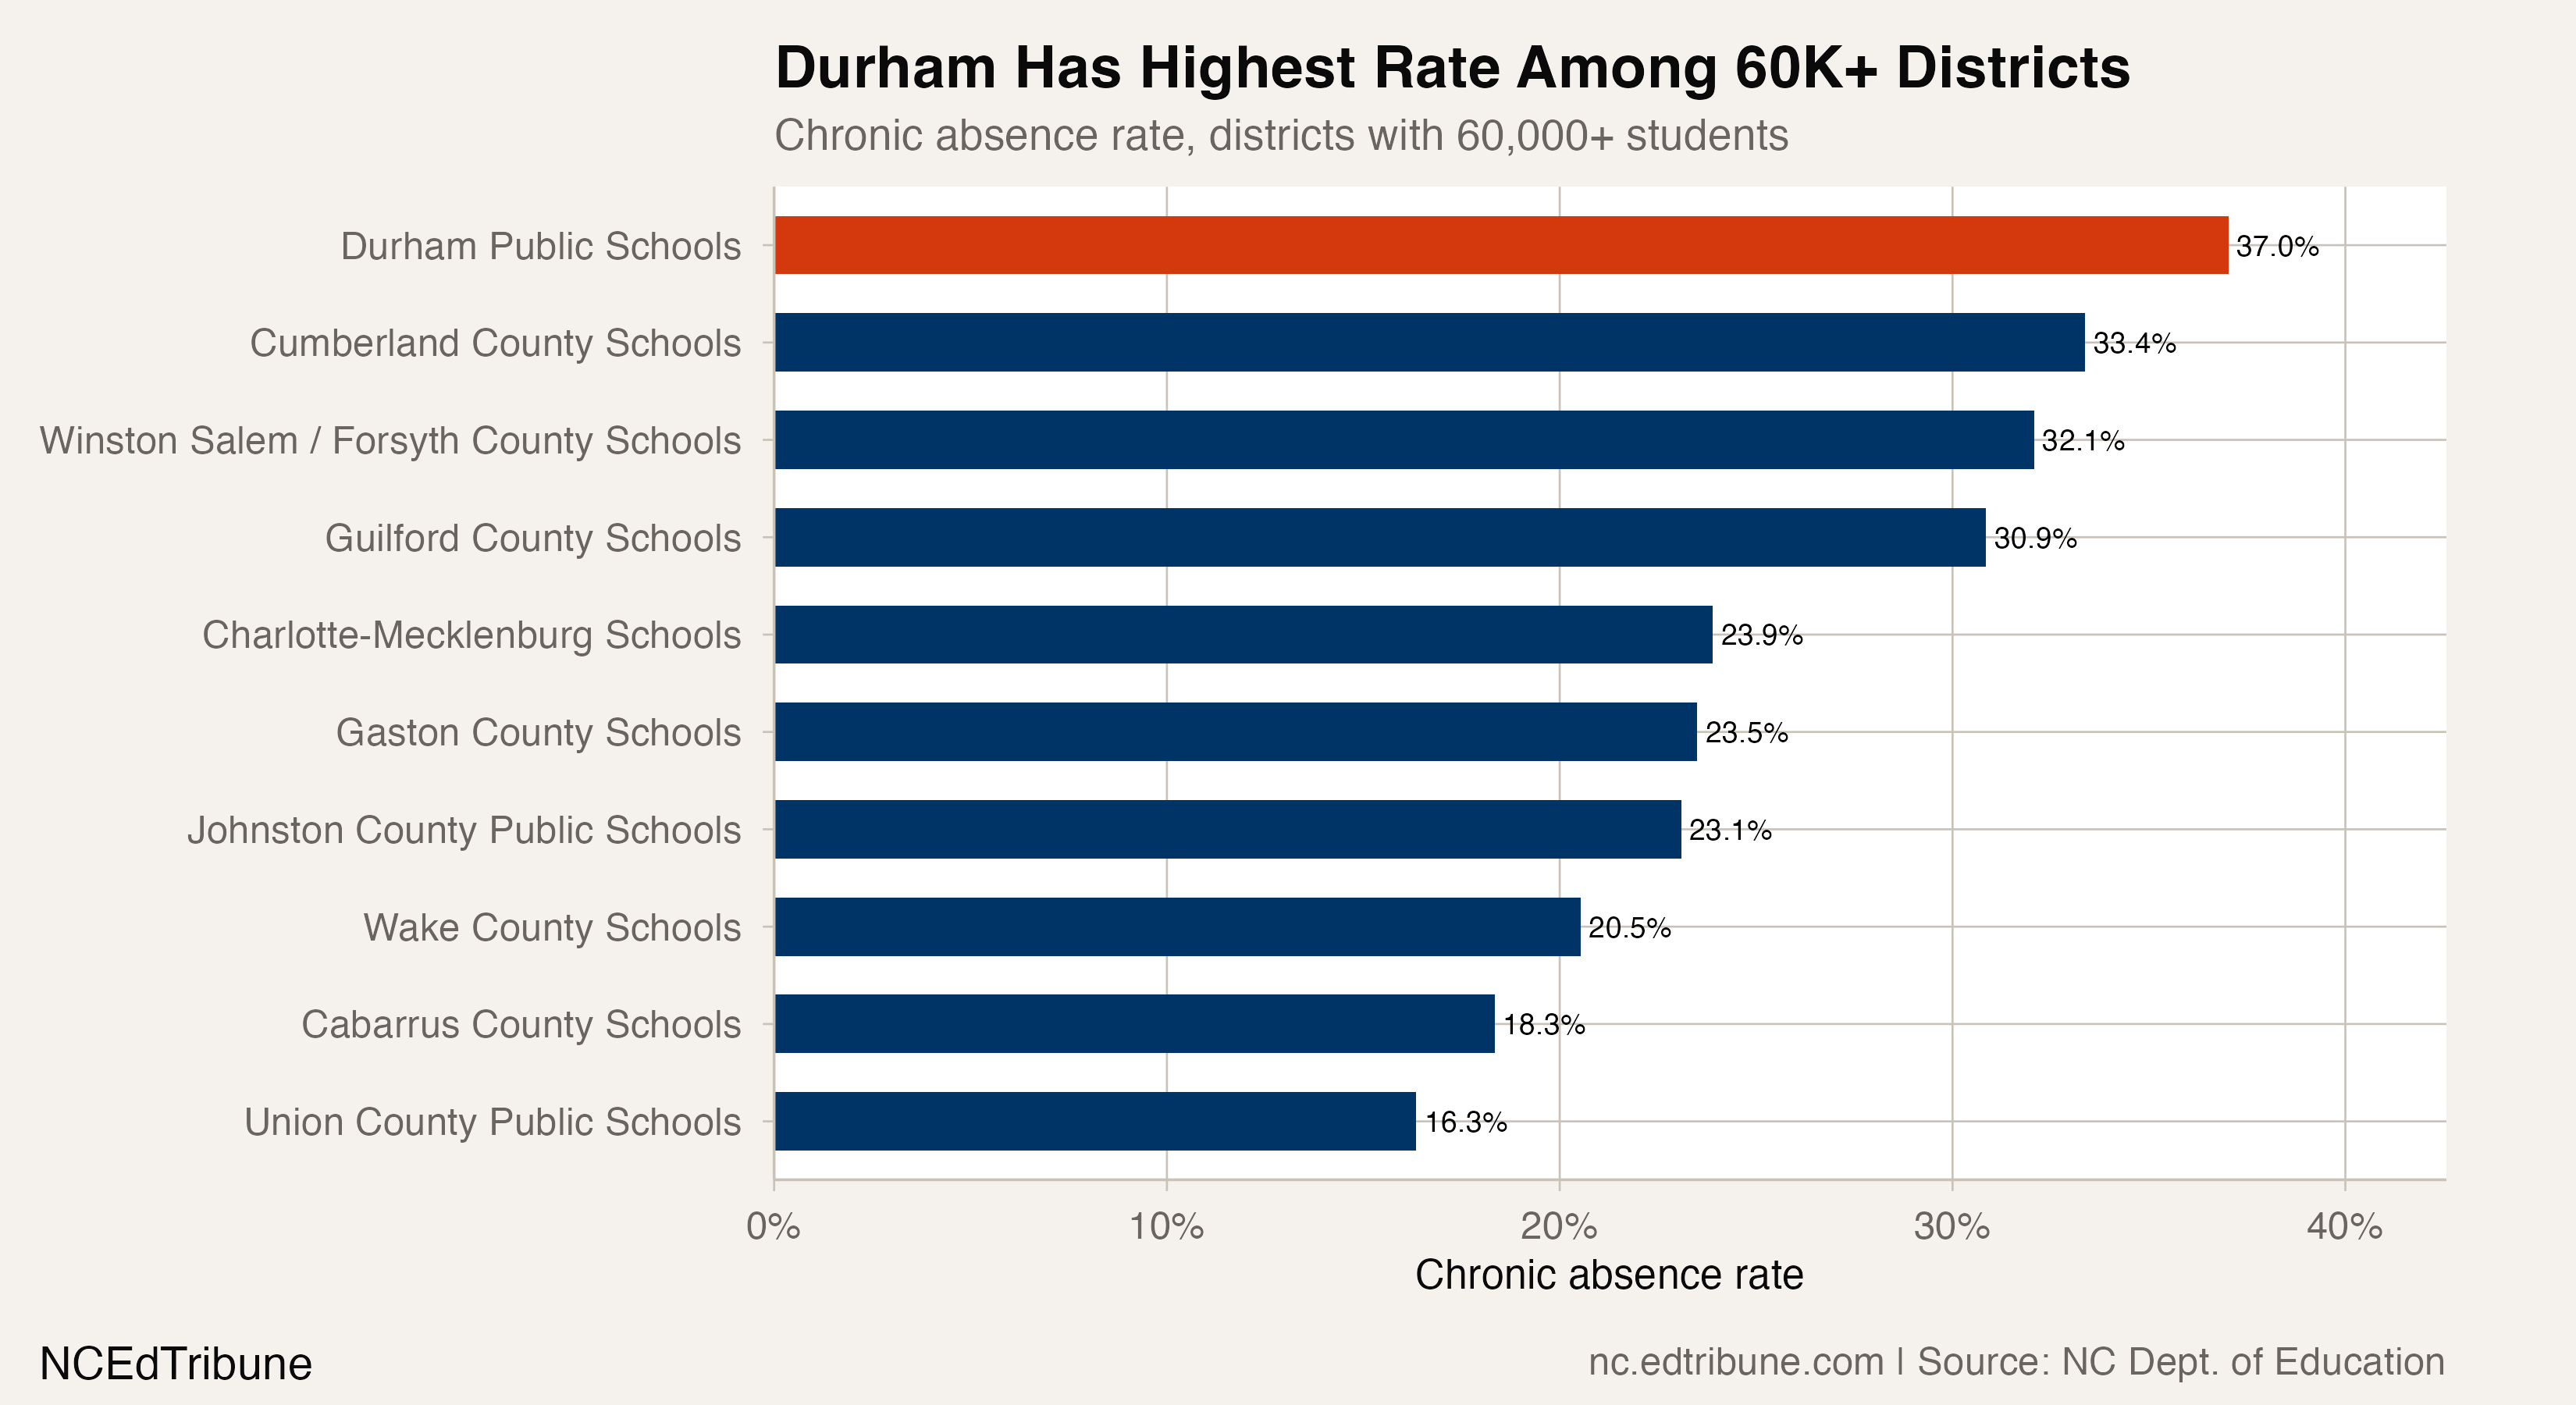
Among the North Carolina districts with 30,000+ students, Durham's 37.2% chronic rate leads by a substantial margin. Cumberland County is next at 33.5%, followed by Forsyth County at 32.1%. At the other end, Union County Public Schools has a 16.5% rate, less than half of Durham's, despite serving 43,105 students in the Charlotte suburbs.
The comparison is not entirely fair. Durham has higher poverty rates and a different demographic composition than Union County. But even adjusted for those factors, the gap is striking. Durham's students who are economically disadvantaged have a 46.3% chronic rate. Its Black students, who make up 37% of enrollment, have a 41.3% rate. Hispanic students, 36% of enrollment, are at 43.5%. English learners, the fastest-growing group at 7,400 students, have a 45.4% rate.
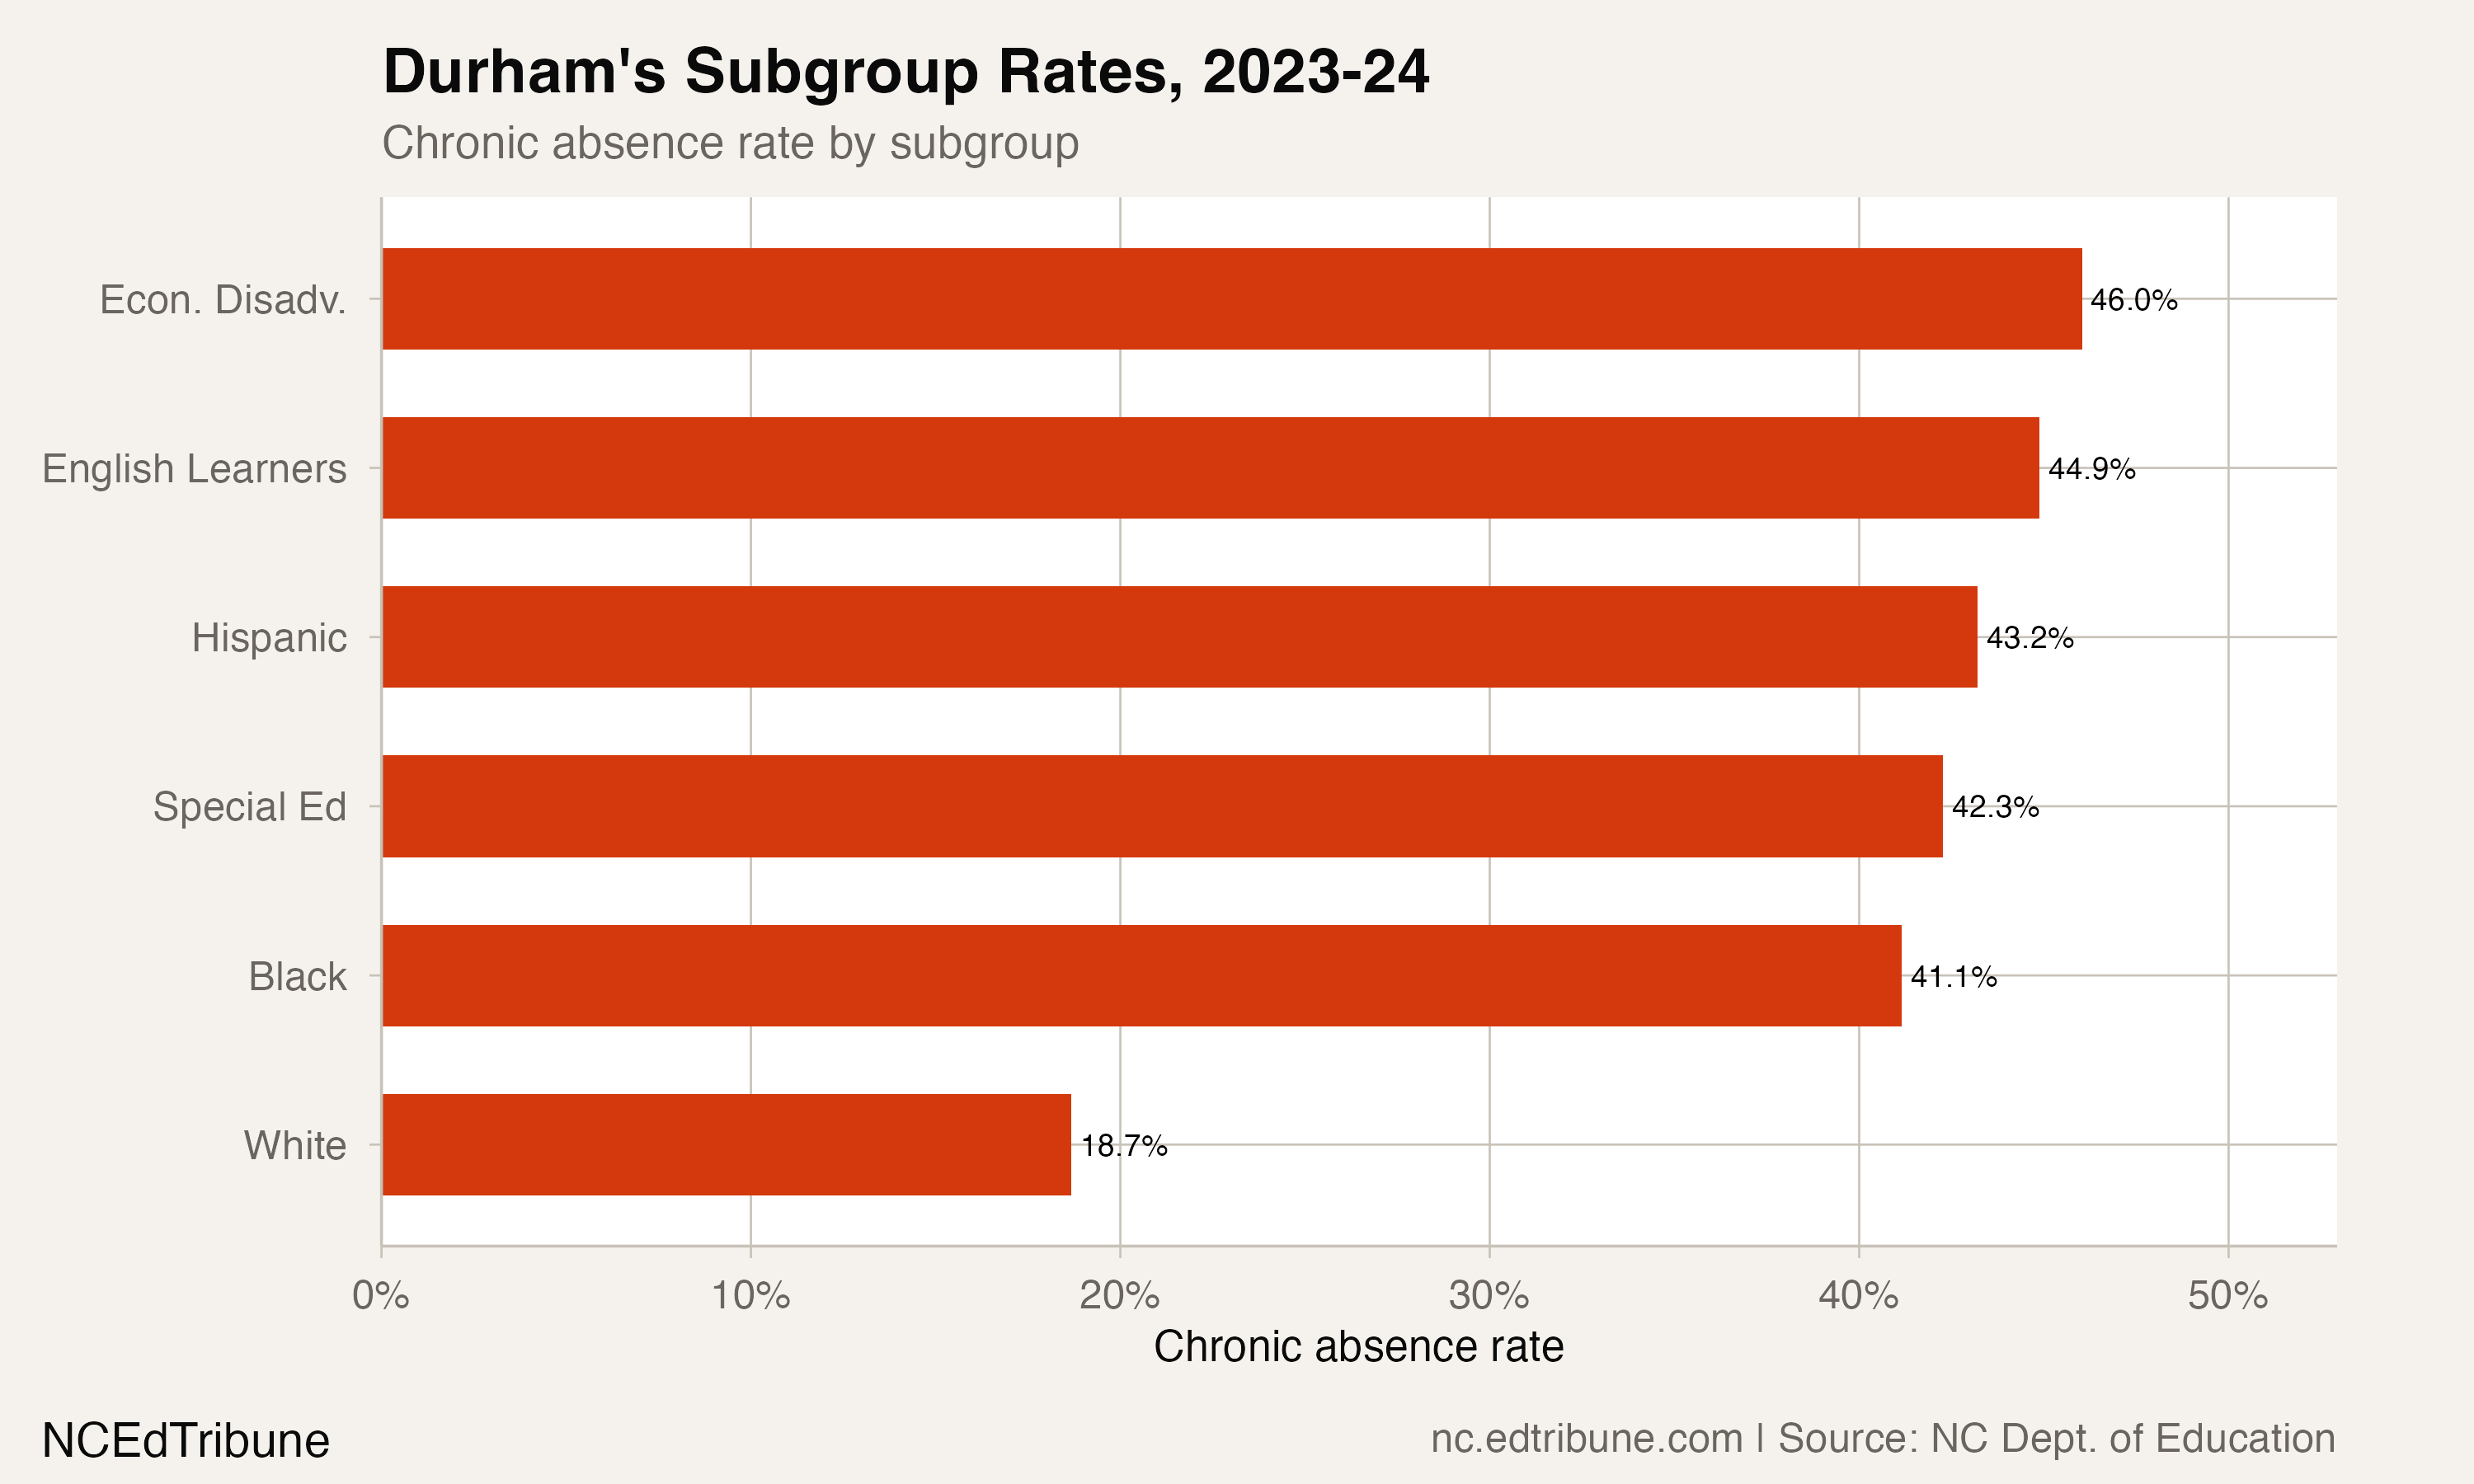
White students, 18.7% of enrollment, have an 18.8% chronic rate, slightly below the state average for white students of 19.9%. The disparity within Durham is starker than the disparity between Durham and the state: a Black student in Durham is 2.2 times more likely to be chronically absent than a white student in the same district.
12,329 students and a plateau
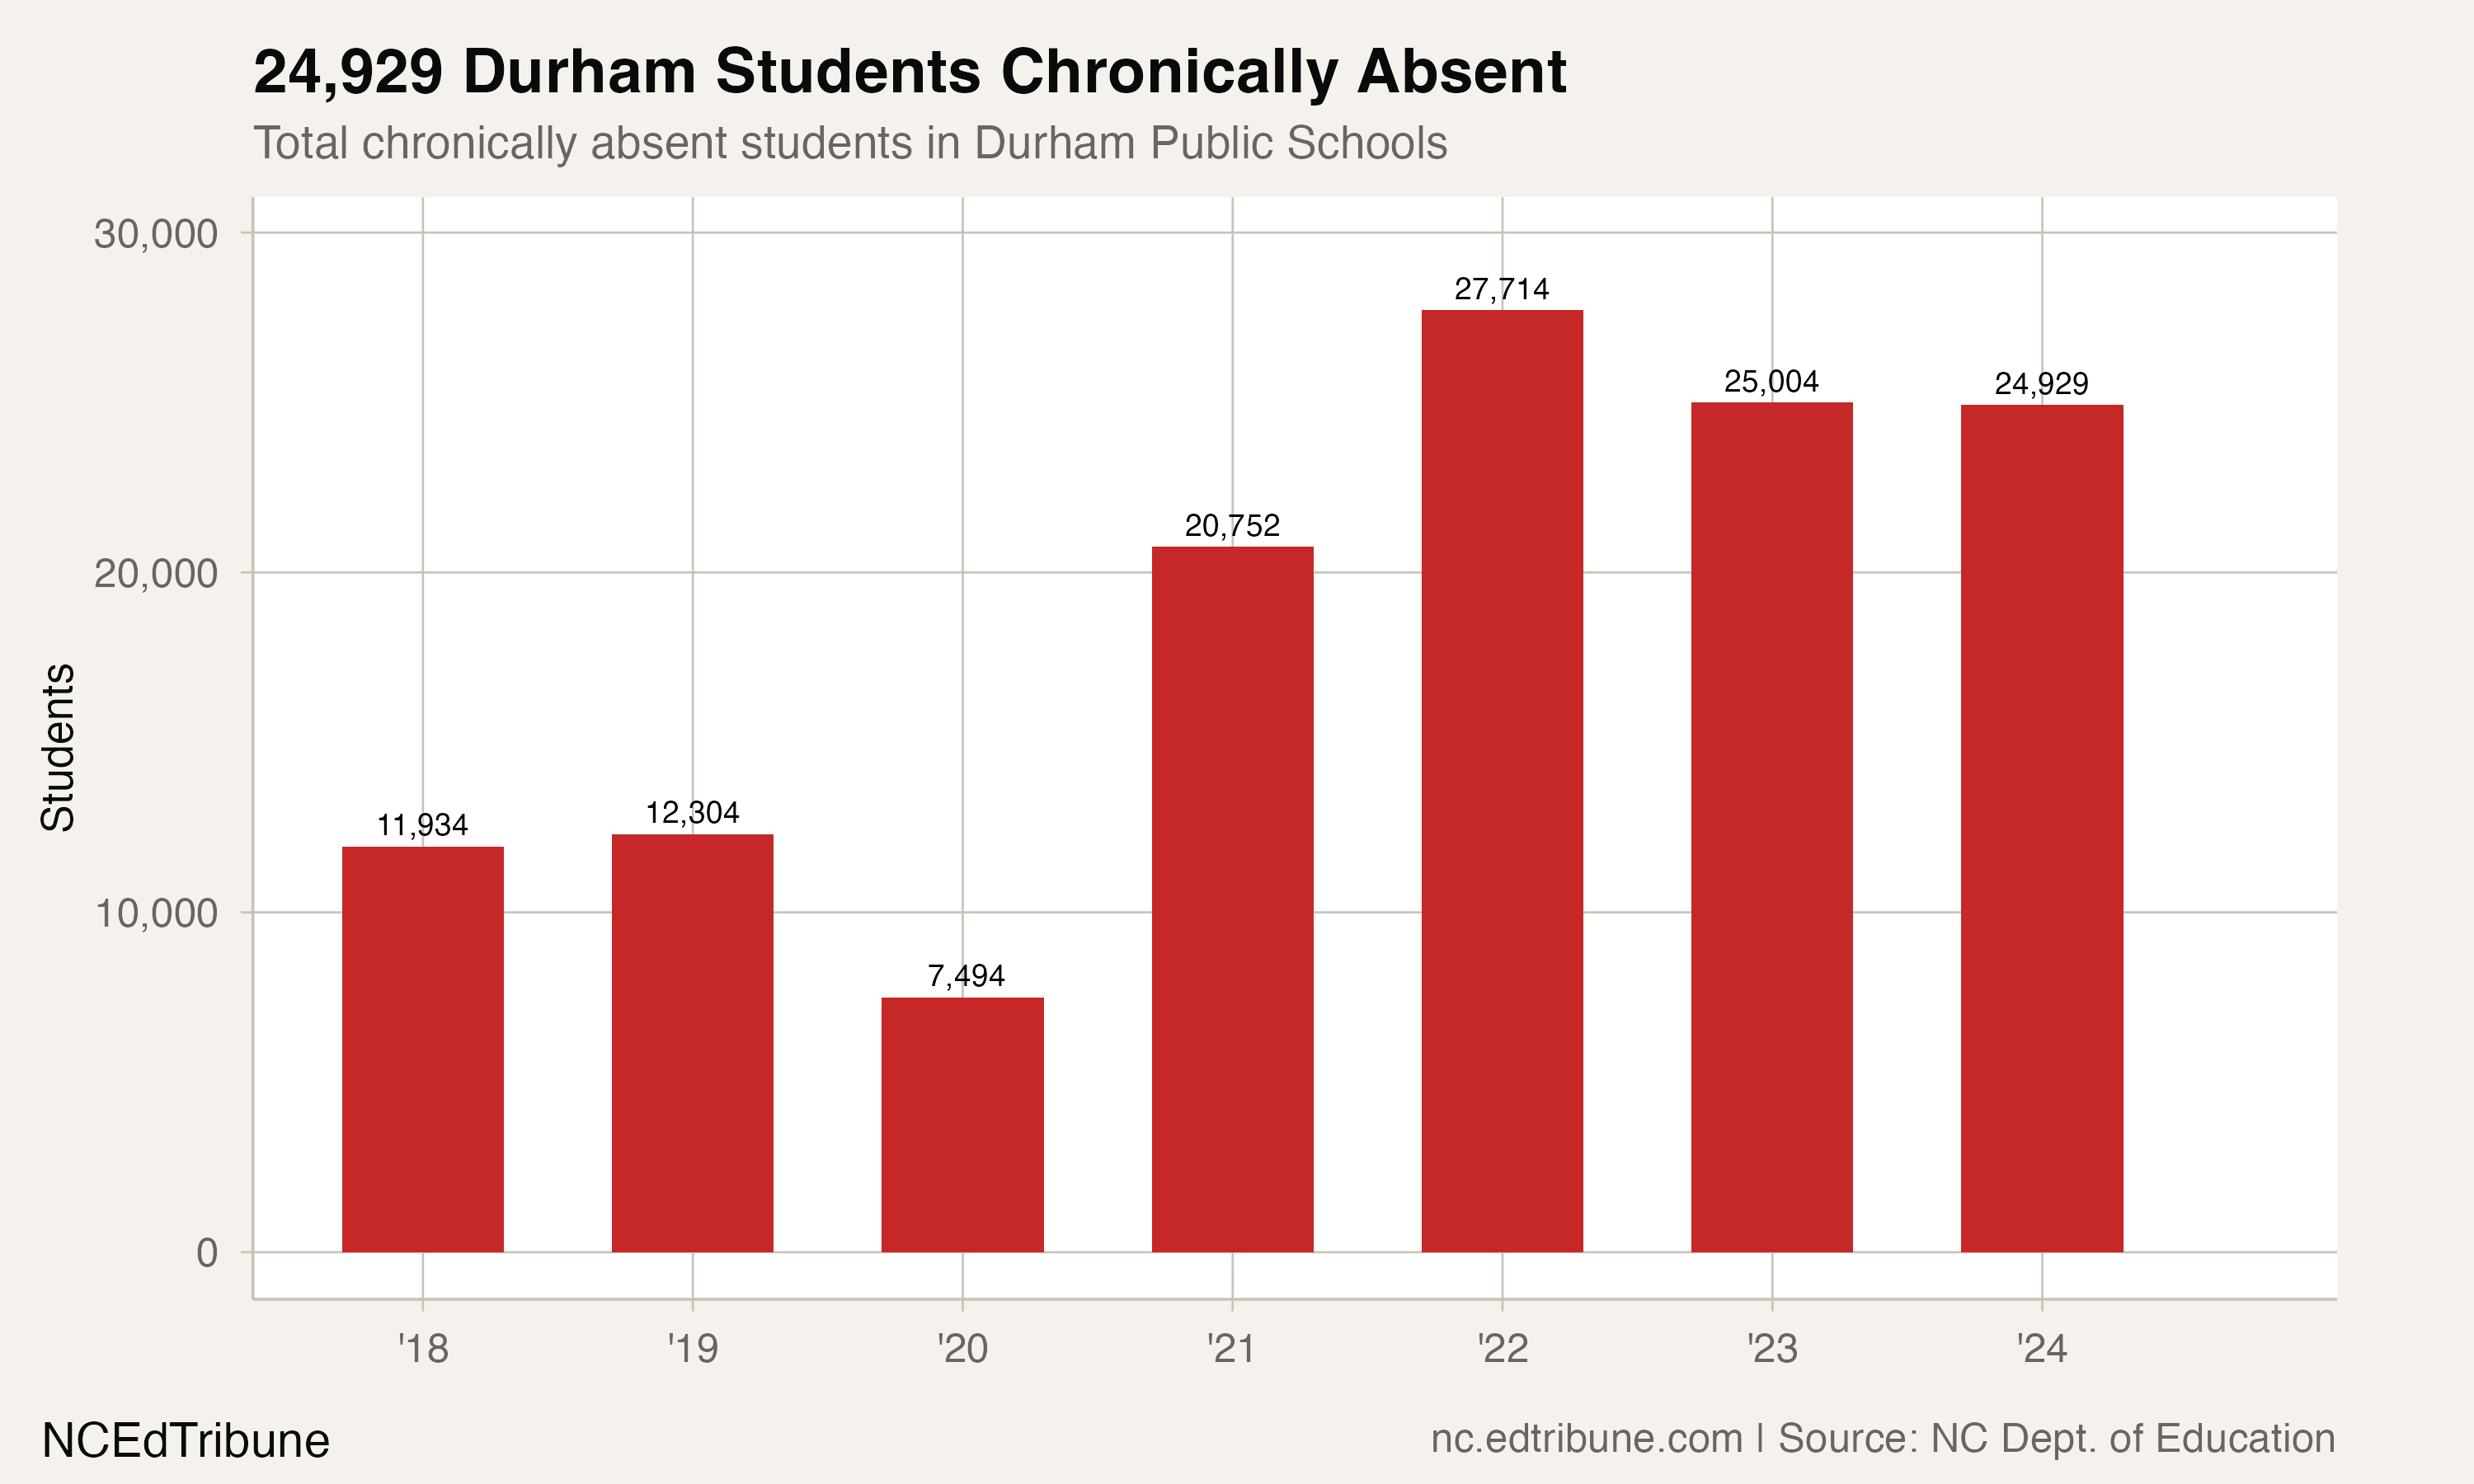
The district's 12,329 students who are chronically absent represent 3.2% of all students who are chronically absent in North Carolina, from a district that enrolls 2.1% of the state's students. Before COVID, the number was roughly 6,100. Durham has twice as many students who are chronically absent as it did five years ago, and the number has not meaningfully declined in two years.
The plateau raises a question that goes beyond Durham: once the students who were going to return on their own have done so, what reaches the rest? Durham is not short on awareness of the problem. The district has attendance tracking systems, early warning indicators, and community partnerships. The stall near 37% suggests that awareness and tracking, absent more intensive individual interventions, hit a ceiling. Breaking through it will require a different approach than the one that moved the rate from 41% to 37%.
Detailed code that reproduces the analysis and figures in this article is available exclusively to EdTribune subscribers.
Discussion
Sign in to join the discussion.
Loading comments...