Correction (June 4, 2026): District-level enrollment and chronic absence counts in this article were corrected after a data processing error that double-counted district enrollment was identified and fixed. Chronic absence rates were not affected. The size-bucket averages, district counts, and named-district enrollment figures have been recomputed from the corrected totals.
The largest districts carry the biggest share of North Carolina's chronic absenteeism crisis by sheer volume: Mecklenburg, Wake, and Guilford together account for 92,221 chronically absent students, or 23.6% of the statewide total. But the worst rates belong to small and rural districts where the problem is proportionally far more severe, even if the absolute numbers are smaller.
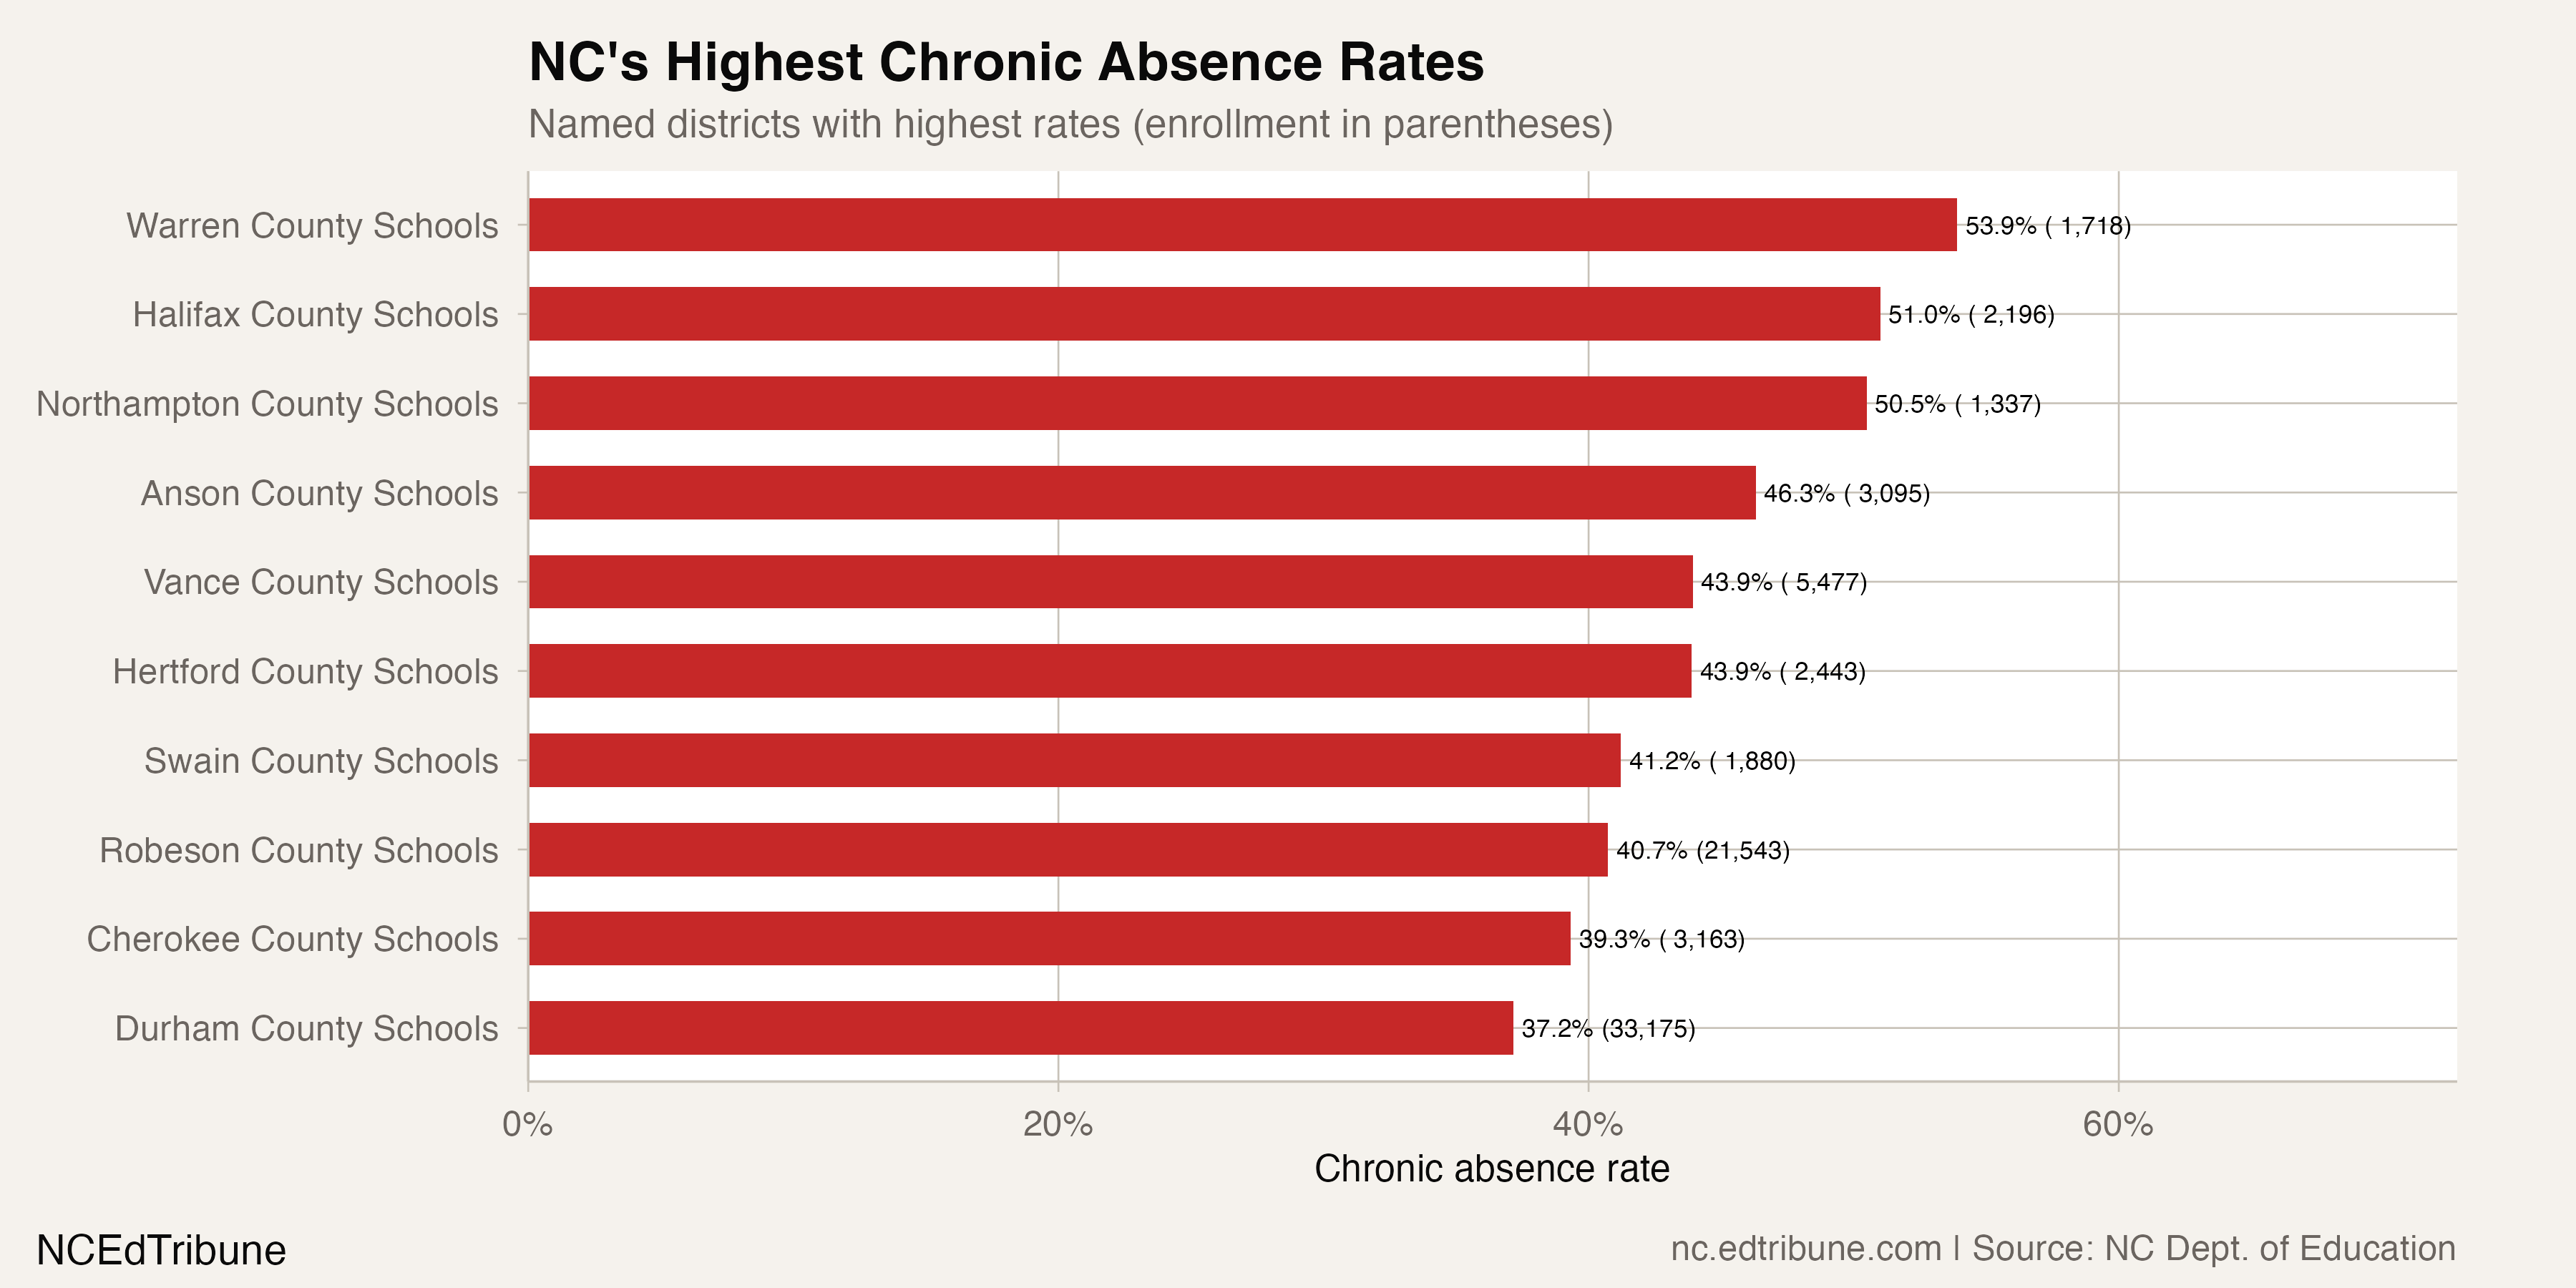
Warren County Schools leads all named districts with a 53.9% chronic rate. Halifax County follows at 51.0%. Northampton County is at 50.5%. All three are in northeastern North Carolina, a rural region where Census profiles for Warren, Halifax, Northampton, and Hertford counties show high-poverty, majority-Black or plurality-Black communities. That context is suggestive, not proof of causation; the attendance file identifies where absence is concentrated, not why each student missed school.
The geography of absence
The cluster of the worst rates in northeastern North Carolina is not just a list of unrelated districts. Warren, Halifax, Northampton, and Hertford counties form a contiguous block, and Hertford's district rate is also high at 43.9%. The data does not show individual causes, but the surrounding conditions matter for interpreting the pattern.
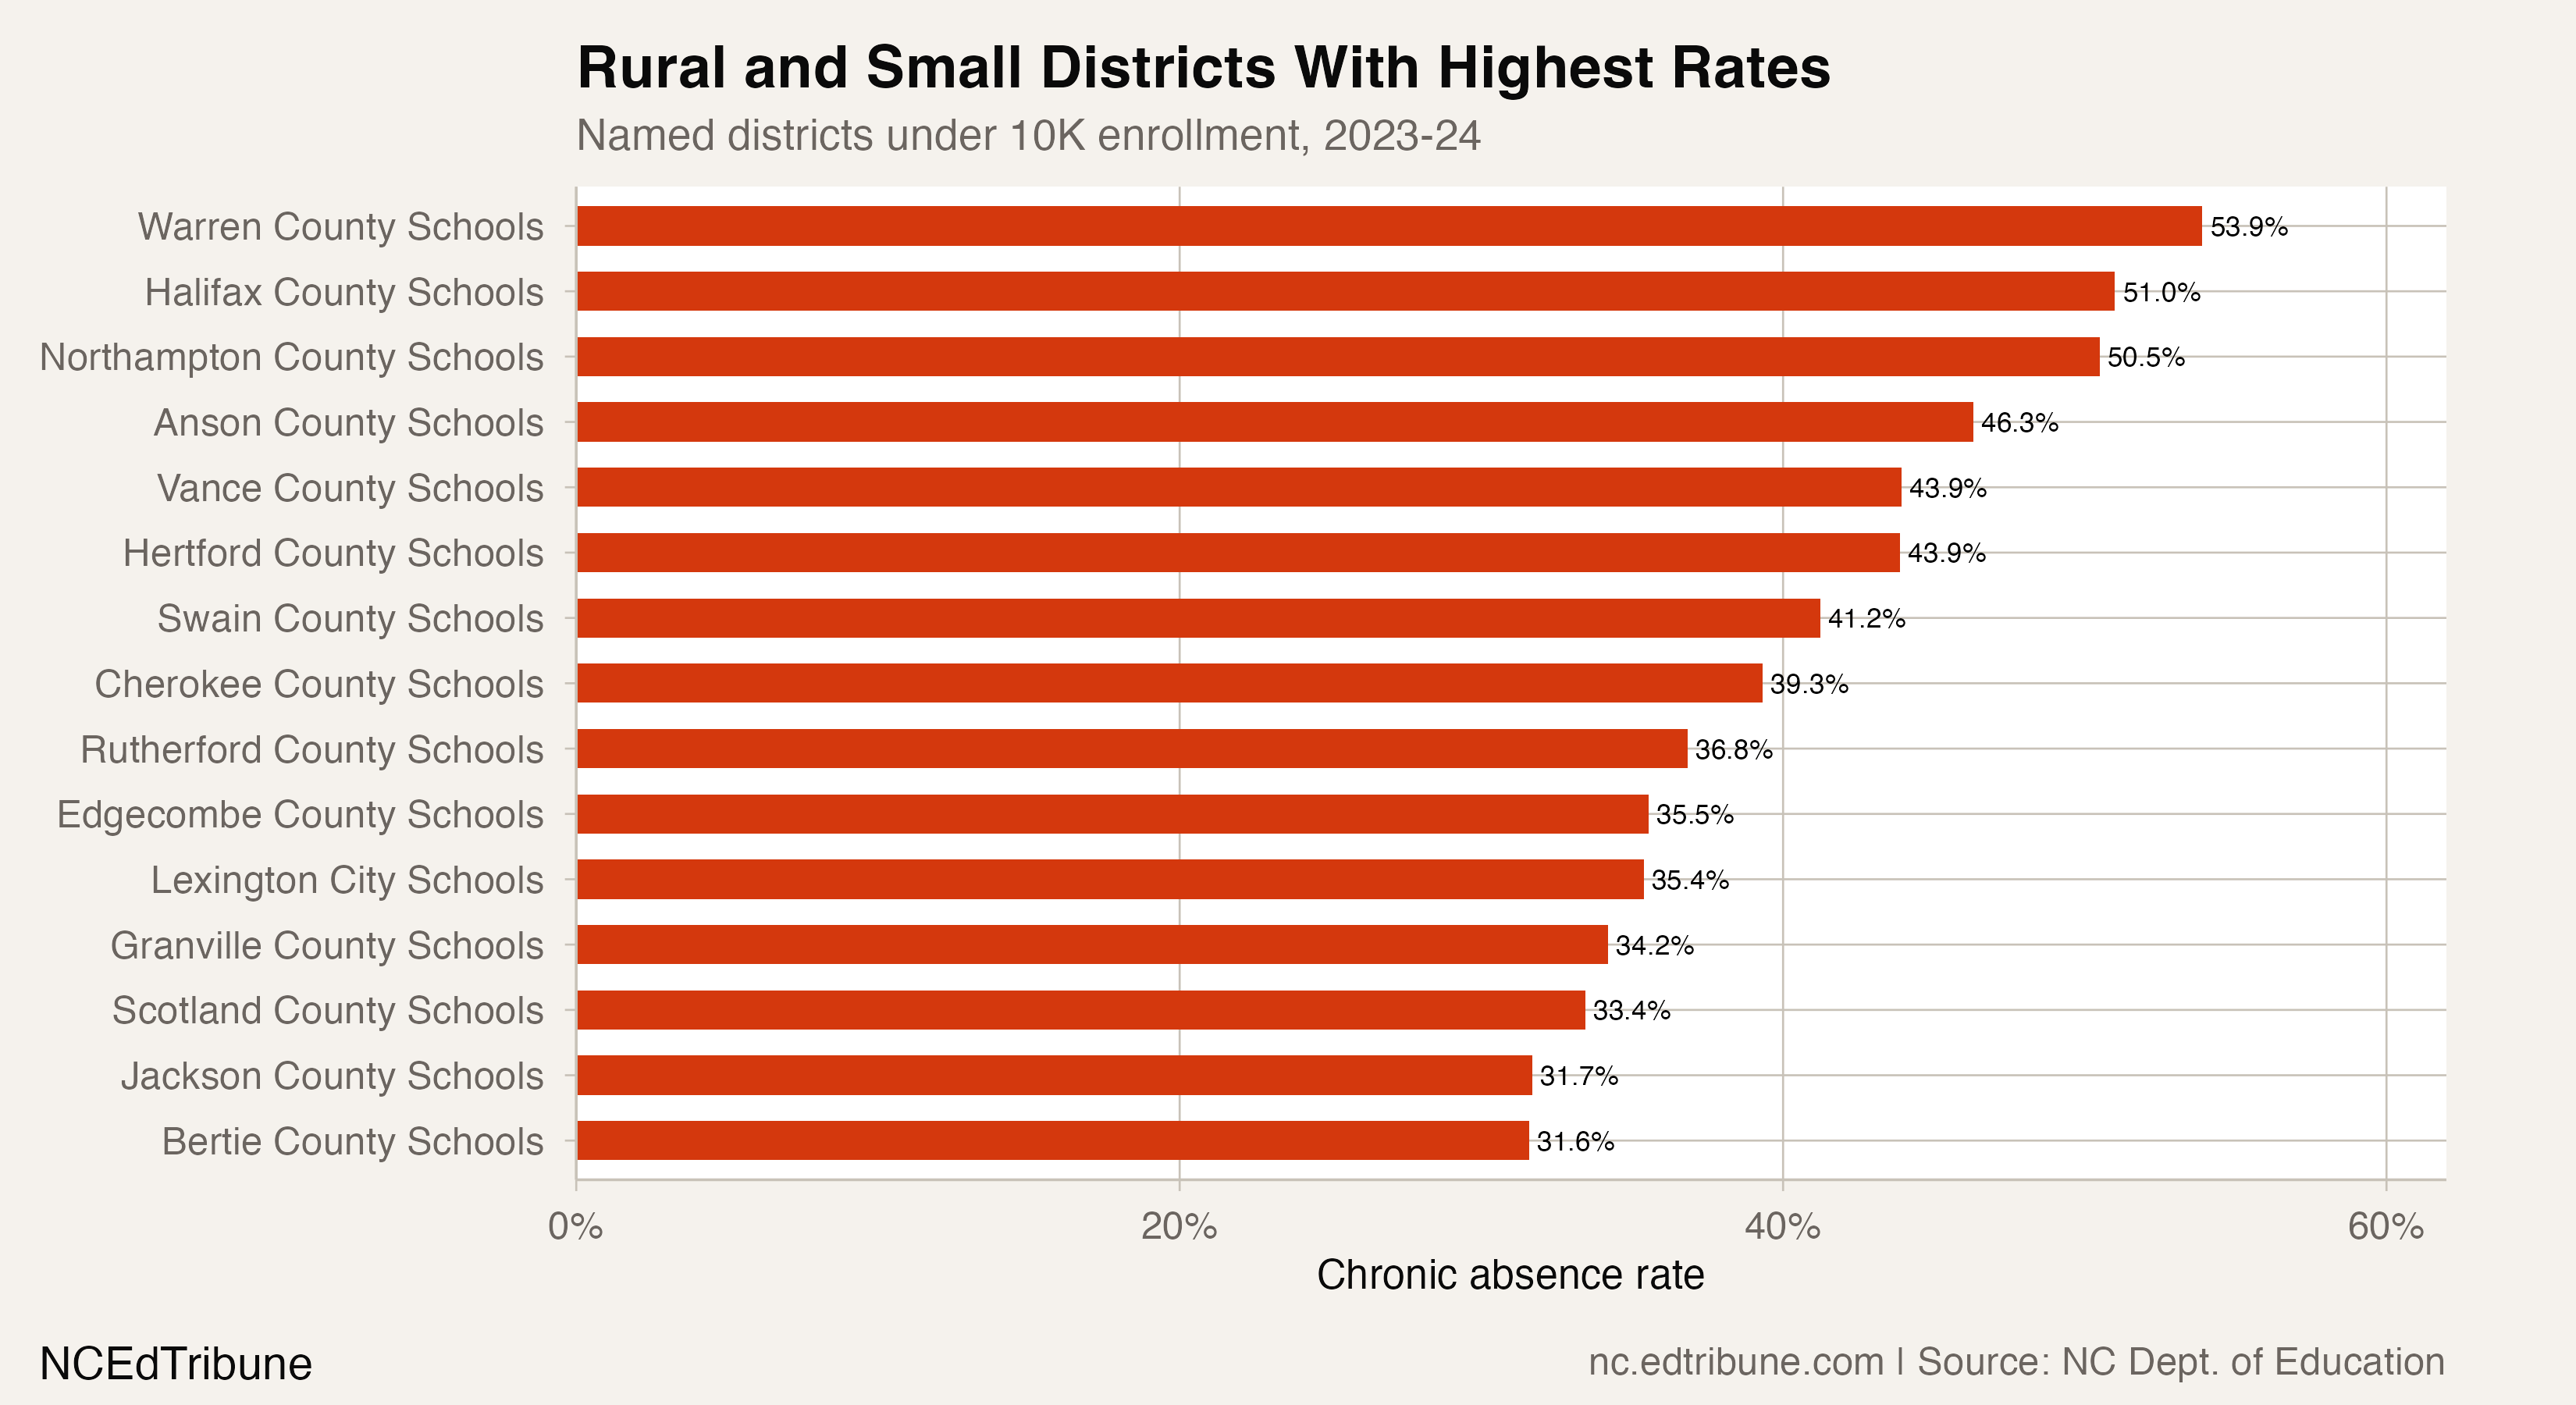
The strongest mechanism evidence here is suggestive context. NCDPI's chronic absenteeism research review says families may face "transportation challenges, housing instability, caregiver work constraints, unmet mental health needs, or negative prior experiences with school," and it classifies transportation, housing, safety, and economic stress as structural barriers beyond the school (NCDPI research review). A state legislative transportation study found that rural school bus routes are generally longer and less flexible, and that in more than one third of North Carolina LEAs the longest 5% of student ride times averaged more than 90 minutes (NC General Assembly report). Those sources do not prove transportation caused Warren's 53.9% rate, but they explain why a rural high-poverty cluster deserves a different policy reading than a large urban district with the same number of absences.
The smallest districts have the highest average rates
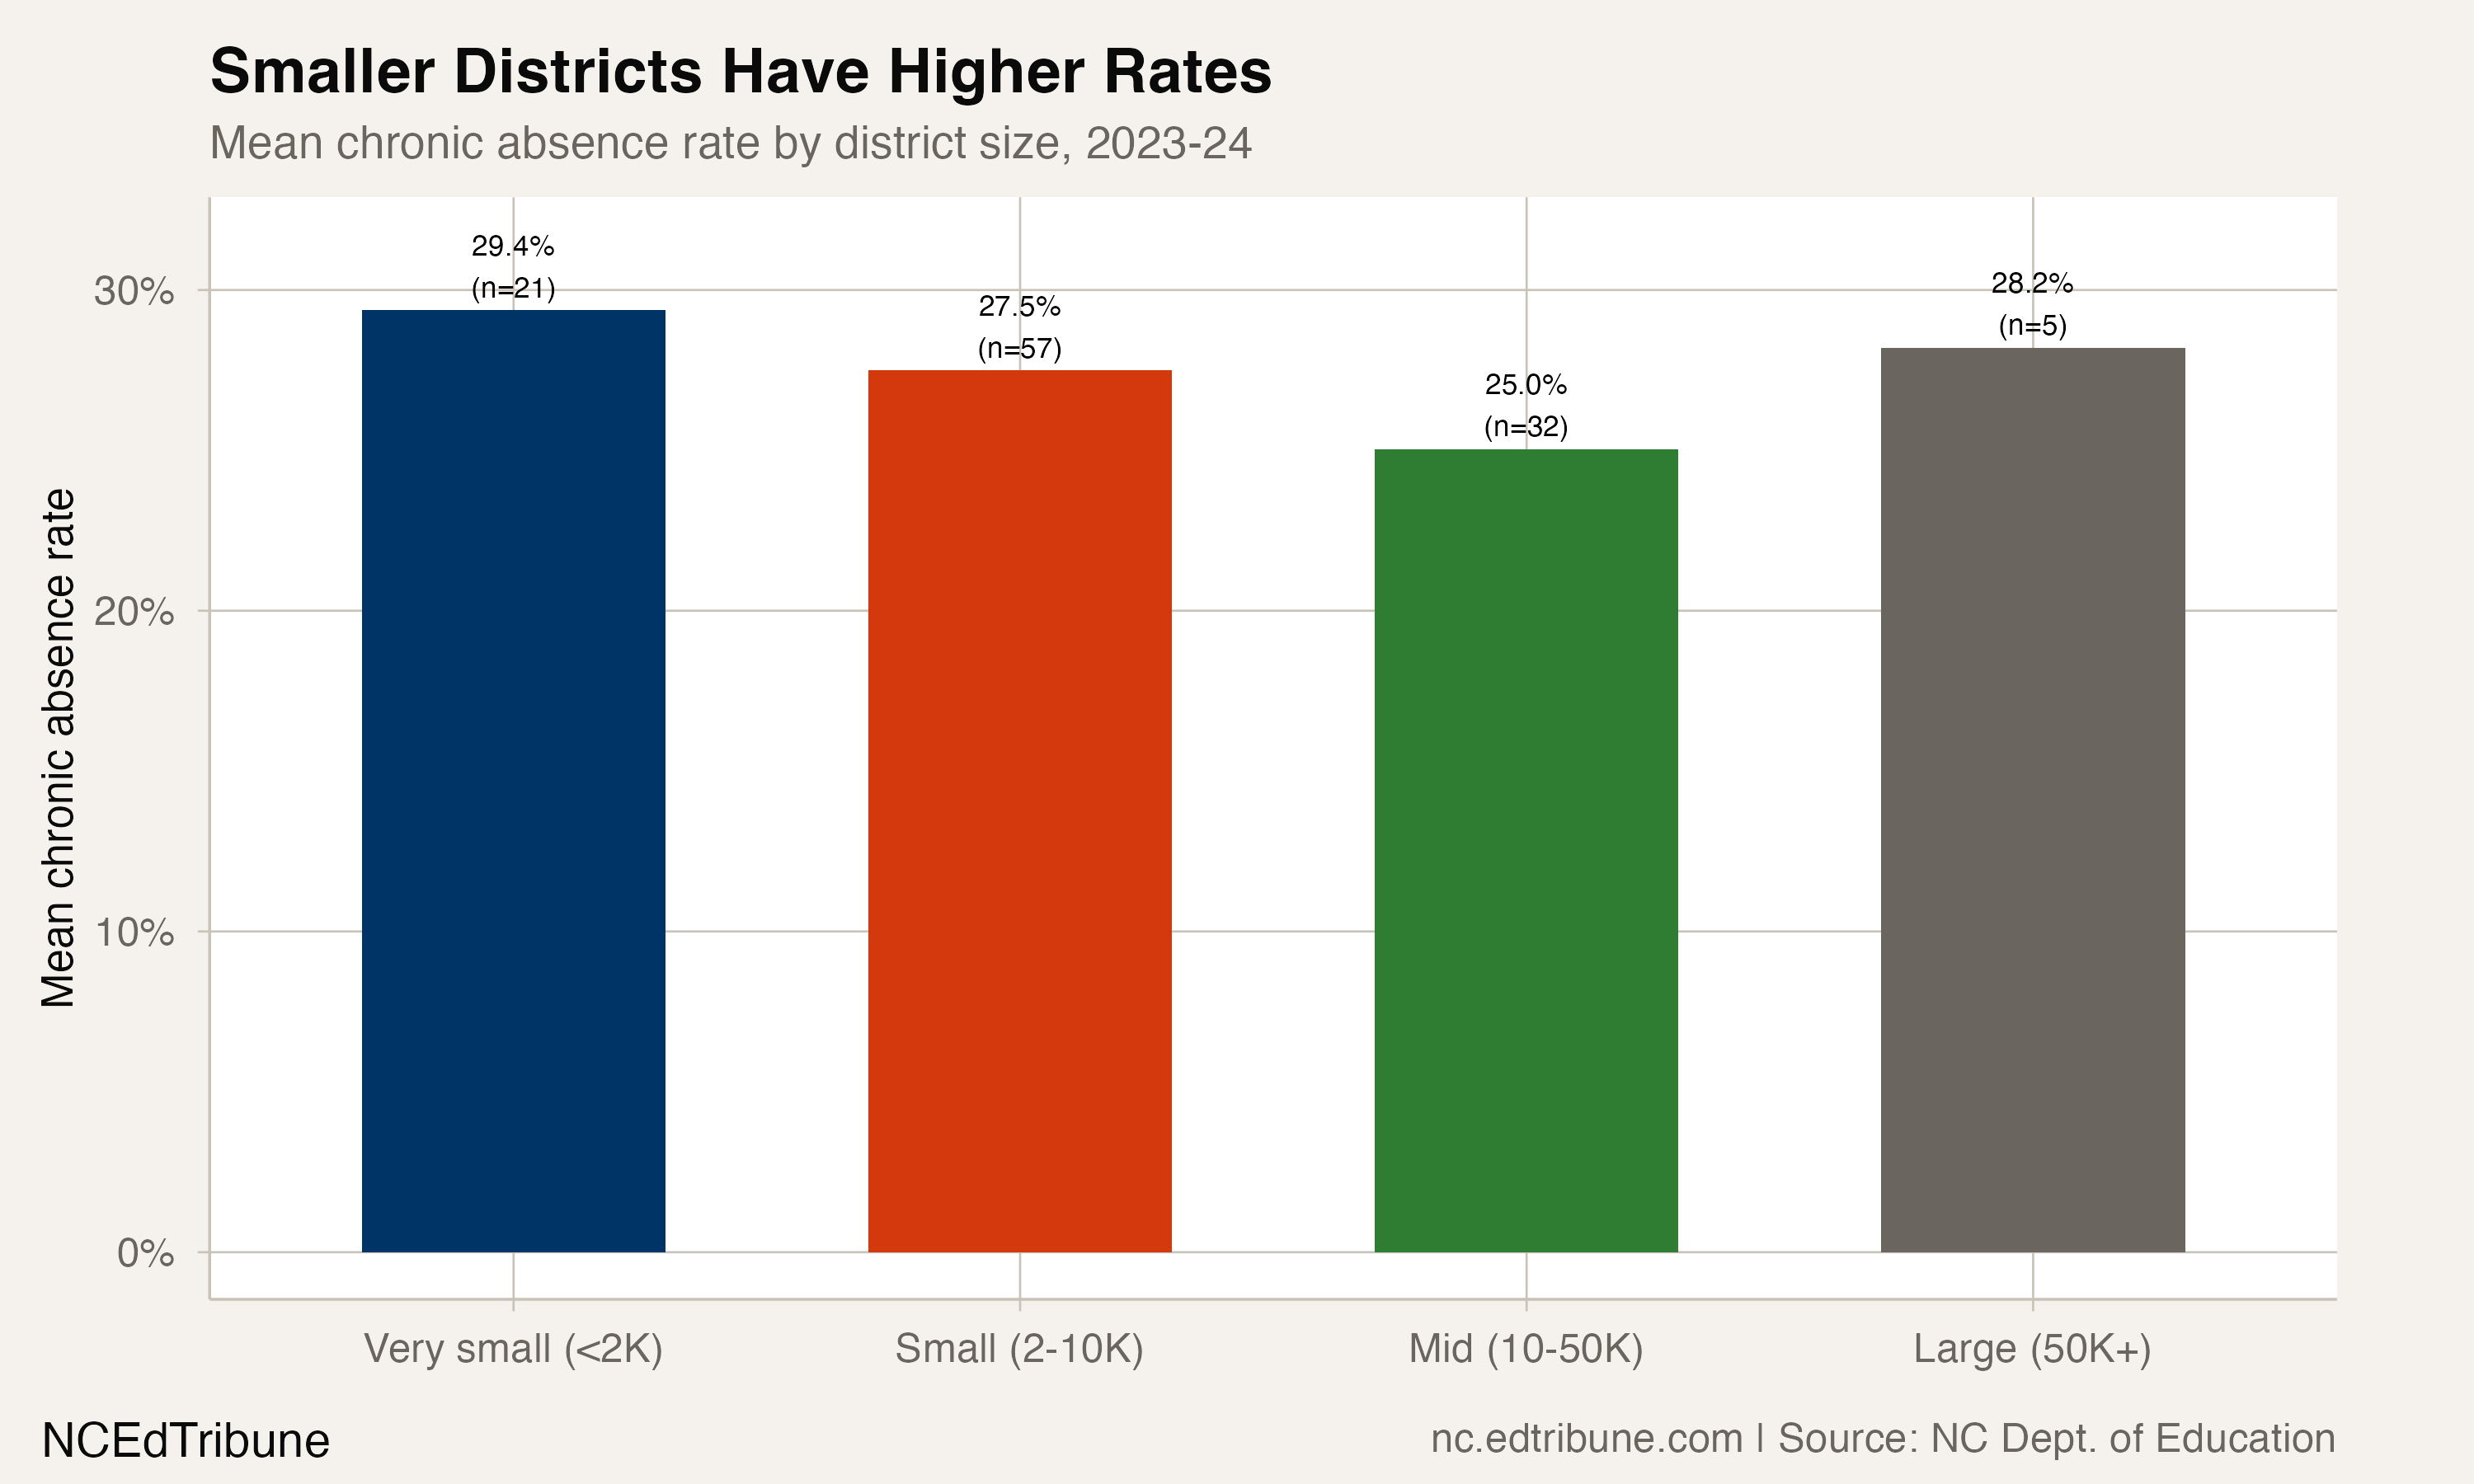
The smallest districts carry the highest average burden. The 21 very small districts under 2,000 students have a mean chronic rate of 29.4%, the highest of any size band. The 57 small districts with 2,000 to 10,000 students average 27.5%. The 32 mid-sized districts (10,000 to 50,000 students) have the lowest average, at 25.0%. The five largest districts (50,000 or more students) average 28.2%, pulled up by a handful of urban districts with severe absence rather than by their size.
The pattern is not a clean line from large to small. It is closer to a U: the mid-sized districts sit lowest, while both the smallest rural districts and the largest urban districts run high. But the heaviest average burden falls on the smallest districts, and the very worst individual rates are theirs as well.
The size dimension matters because a district with 1,718 students and a 53.9% chronic rate is trying to solve a majority-absence problem with a much smaller operating base than Wake, Mecklenburg, or Guilford. NCDPI's attendance guidance emphasizes multi-tiered, relationship-centered systems, early warning routines, family outreach, and integrated supports (NCDPI AttendNC guidance). That is suggestive context for the capacity challenge: the same intervention menu can look very different in a small rural district than in a district with tens of thousands of students.
What transportation means
In districts like Warren County, the chronic absence rate exceeds 50%. At that level, the label "chronically absent" loses some of its explanatory power. North Carolina defines chronic absenteeism as missing 10% or more of enrolled school days, roughly 18 days in a typical year (NCDPI). When a majority of students cross that threshold, the safer conclusion is not that individual families stopped valuing attendance. It is that district leaders are confronting barriers broad enough to show up across an entire community.
The data identifies the where but not the how. For rural northeastern North Carolina, the relevant question is whether students can get to school reliably, whether families can navigate health and work constraints, and whether attendance teams have enough capacity to respond before sporadic absence becomes chronic. Those mechanisms remain suggestive context rather than direct evidence for any one district, but the rates in Warren, Halifax, Northampton, and Hertford show that the problem is concentrated enough to demand district-specific answers.
Detailed code that reproduces the analysis and figures in this article is available exclusively to EdTribune subscribers.
Discussion
Sign in to join the discussion.
Loading comments...